
Simple enough to be embedded in text as a sparkline, but able to speak volumes about your business, time series data is the basic input of Anodot’s automated anomaly detection system. This article begins our three-part series in which we take a closer look at the specific techniques Anodot uses to extract insights from your data.
What is time-series data?
Time series data is composed of a sequence of values over time. Normally, each point is a pair of two items: the moment in time the metric was measured and the value of that metric at that point in time. Once plotted, a time series gives a viewer a sense of how that value has behaved over time, up until the last data point. That last data point could be right now if the sampling rate is fast enough and there’s no lag between sampling and reporting (i.e. the time series is plotted in real-time).
There is one important thing to keep in mind: the time series data itself is a record, not a projection. That record, however, contains information which can allow us to make educated guesses about what we can reasonably expect in the future. It is the task of time series anomaly detection to use those reasonable expectations to find actionable signals in the data, because those signals often take the form of anomalies (i.e. unexpected deviations in the data).
The key performance indicators (KPIs) which are best suited for analysis as a time series data are the ones which are inherently time-oriented and repeatedly sampled. Here are some common examples:
| Mobile Apps | AdTech | ECommerce |
| Webpage views Daily active users Mobile app installs Online sales broken down by user’s demographics In-app purchases Sales by platform Sales by geo location |
Cost per lead Cost per click Cost per acquisition Impression share Marketing ROI Bounce rate Time on site Page views Click-through rate |
Churn rate Shopping cart abandonment Conversion rate Refund/return rate Revenue per click Number of transactions Average order value New user rate |
How does Anodot detect anomalies in time series data?
A time-series anomaly detection system must first learn the normal behavior of a metric before it can effectively spot anomalies in it.
Here’s a high level summary of how Anodot’s system detects anomalies in time series data:
- The system first classifies the time series data and then selects the optimal mathematical model that will be used for describing the normal behavior of that data.
- The system determines the temporal statistical distribution of data points to be expected in that data, given the model.
- Anodot’s system applies a statistical test to all future data points based on that expected distribution. If the present value for a metric falls outside that distribution, it is most likely an anomaly.
This is a very general summary which glosses over the complexity, challenges, nuances, and competing requirements which arise in implementing each step. One of them is worth discussing here: the importance of modeling seasonality.
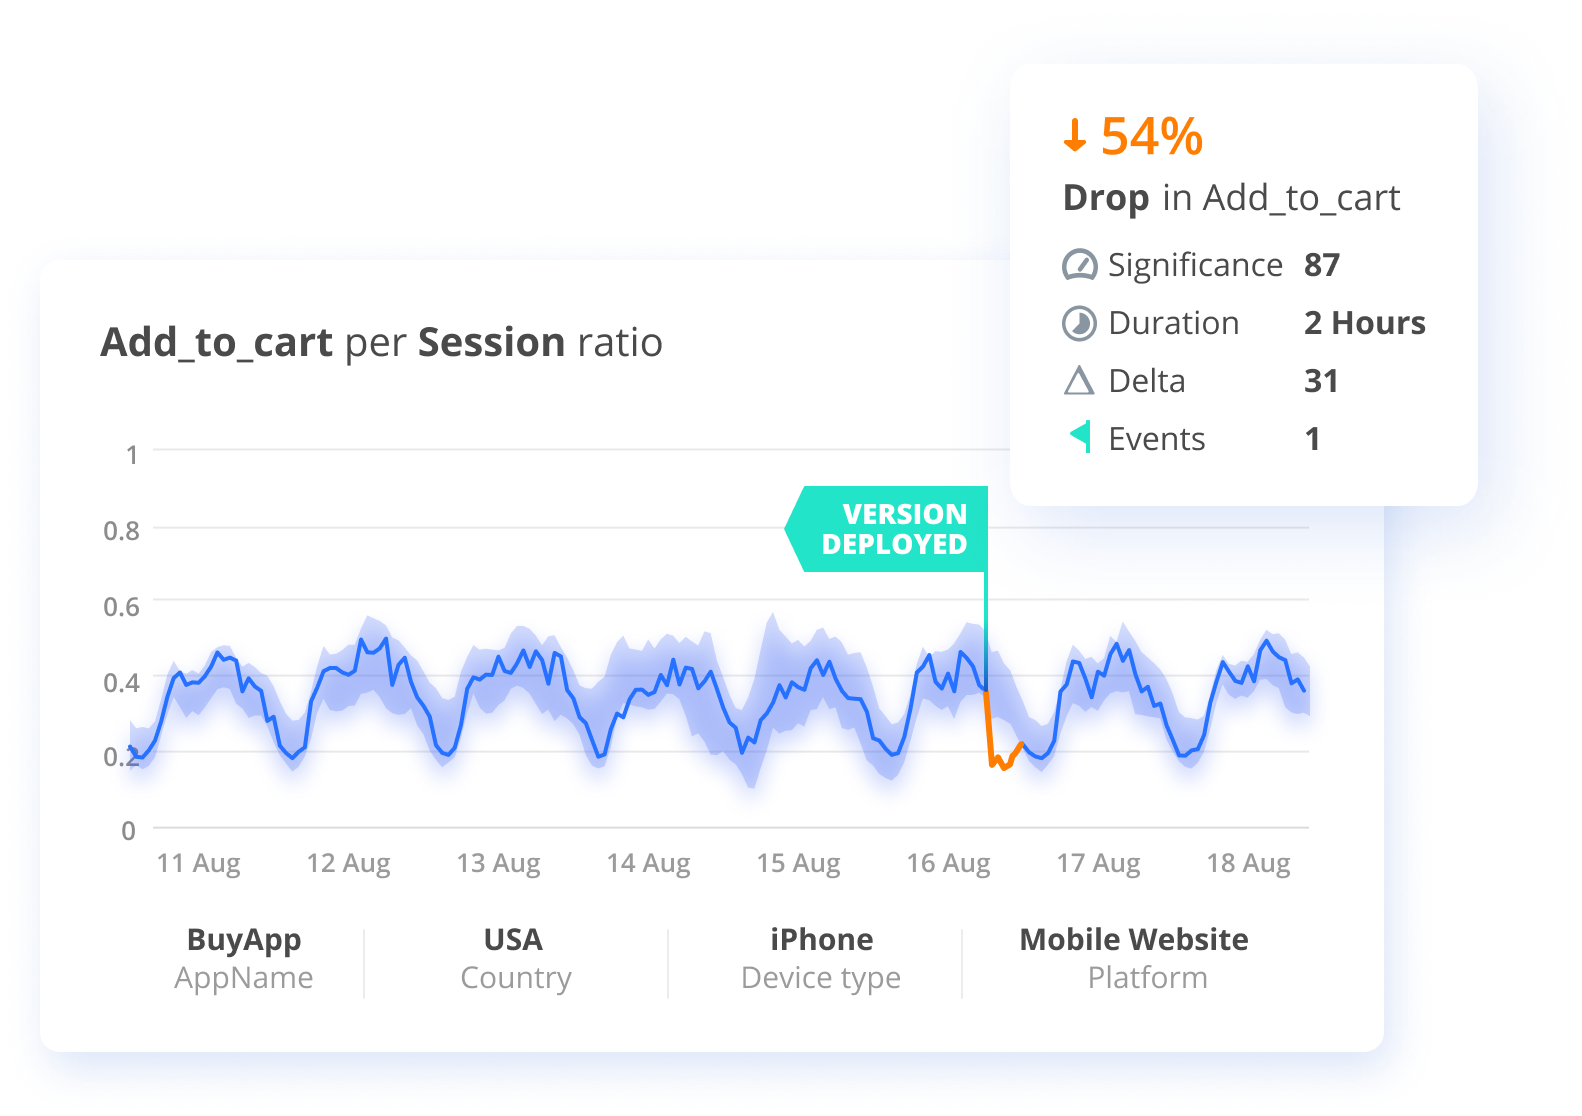
Notice the cyclical patterns, as shown by the oscillating line, in this time series data measuring the rate of customers adding to their shopping carts on an eCommerce site. By creating a baseline around this seasonal behavior (re: shaded blue sleeve around the data), it’s easier to spot deviations (orange segment of the line) that wouldn’t normally transcend static thresholds.
Seasonality refers to the presence of cyclical patterns in the time series data. That seasonal cycle can have the shape of a smooth sine wave or a jagged sawtooth. The period of the cycle can span from hours to a full year or more. Seasonal patterns are changes we expect; they are part of the normal behavior of a given metric and thus must be included in the model of that metric. For some metrics, however, there are no seasonal patterns. And sometimes, multiple seasonal patterns are present in a time series.
Not only must the normal behavior model include every one present, but also any interactions between them. In some cases, a person is able to look over the plot of a given time series and determine if that time-series data has any seasonal data, but this manual approach is not scalable to thousands or millions of metrics.

How can an automated system detect data seasonality?
One method is the Fourier Transform, which is fast and computationally efficient but doesn’t work well when there is more than one seasonal pattern. Also, it is very sensitive to any missing data. Serial correlation (also known as autocorrelation of signals, autocorrelogram, or ACF), is both more accurate and less sensitive to missing data than using Fourier Transform but is also more computationally expensive.
Anodot uses its own proprietary algorithm, named “Vivaldi.” Vivaldi is based on ACF, but uses smart subsampling, which reduces the required computation. By applying this method on multiple filtered versions of the same time series, multiple seasonal patterns can be detected.
Forest, trees or both?
Anodot’s automated anomaly detection system works in real time and scales up to millions of metrics. At that huge number of time series, even perfect anomaly detection with no false positives will result in an overload of alerts. Is there a way to have both granular per-metric anomaly detection while at the same time combining those separate signals to get a sense of the bigger story the data is telling us?
There is a way. In fact, we’ll see how in our next post.
Written by Ira Cohen
You'll believe it when you see it