Most organizations monitor and report the overall availability of their site or service. Here is an example of how Facebook reports the status of their API availability on their developers’ site.
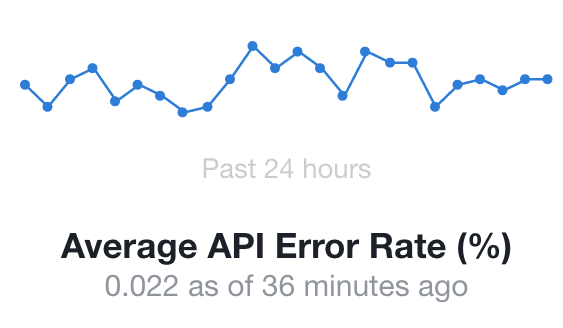
This error rate represents 99.978% availability, which is fantastic! But what if it means that this is a result of one of the following scenarios:
- 100% failure on android Jelly Bean 4.2.x
- 25% failure for a new promising startup that is integrating with Facebook’s authentication services
Facebook’s DAU (Daily Active Users) hit 1.18 billion according to their last earning report (Q3 2016); if we assume that each user represents only 1 API call per day, that means 259,600 API calls fail daily. And that means 259,600 users experience failed interactions. How can we find the common dominator for those interactions to find the root cause and fix it? Which API has the most errors? In which region? On which browser?
When we average things out, we lose visibility of the underlying root cause that impacts the metric we are measuring, be it availability, transaction volume or conversion rate. It’s like the statistician’s joke: “Then there was the man who drowned while crossing a stream that was, on average, six inches deep.”
Most organizations look at the big picture and act only when there is a significant change to one of the key metrics. But the fact of the matter is that the business impact of many small events over time (figure 1) can be the same or worse than one short major incident (figure 2).
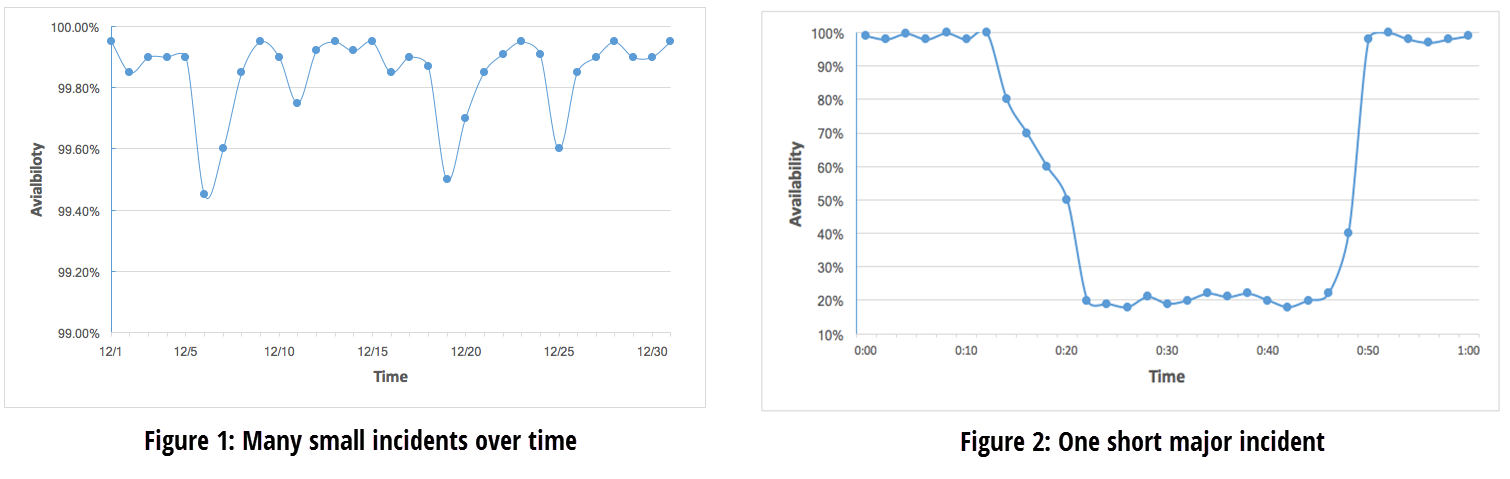
| Average Monthly Availability: 99.85% | Impact Start: 0:14
Restore: 0:50 TTR: 36 minutes Average Hourly Availability: 59.5% Average Daily Availability: 98.22% Average Monthly Availability: 99.85% |
There are few constraints that drive organizations to take a high level look at metrics:
- Technology: Until recently, technology didn’t support the level of granularity required to monitor the health of individual transactions. Dashboards can’t scale for more than a few dozen signals and setting up alerts at a granular level (e.g. customer, partner, city) was not supported due to performance and scalability challenges.
- Human brain: Even if we could provide multiple dashboards with hundreds of different signals, the human brain is not equipped to process all of them and definitely not equipped to correlate the different signals to find the root cause of an issue.
When a popular ride sharing startup was in its earliest stages, a critical partner integration would break occasionally and go unnoticed for hours. Once the problem was detected, the startup’s dev ops would have to call the account manager at the partner company to have the issue fixed. The partner, with millions of merchant integrations, simply could not monitor the health of each integration, therefore compromising by looking at enterprise level KPIs (maturity level 1 for detection and 5 for collection). Four years later, the ride sharing startup became one of the partner largest customers with a huge volume of traffic. The startup didn’t stop working with the partner mainly due to personal relationship – but what if they had? How many other customers didn’t have the same personal relationship with the partner company and moved their business somewhere else?
The only way to solve this issue and get insights on a granular level is by embracing new machine learning and anomaly detection technologies that can process huge amounts of data in real time and surface anomalies on an indefinite number of dimensions. This enables the shift to a new paradigm, BI 2.0, in which machine learning is used to gain deeper insights into business metrics and automated correlation enables faster root cause analysis.
If this sounds familiar, you should consider implementing an anomaly detection solution to see how many insights are hidden in your data. I know that you might think that you need to hire data scientists to implement such a solution but the reality is that it is much easier than you might think. Take advantage of advanced anomaly detection products that automates the entire process. All you need to do is push your metrics and uncover the hidden insights.
Written by Avi Avital
You'll believe it when you see it