
🎁 New Features
- A new API – divert streams API – Moving a stream from one source to another. Documentation can be found here.
- PromQL Agent now enables adding HOST headers for connection to prometheus.
- A new agent for RRD files.
- Observium agents now allow measurement transformations as well as skipping non-type values in measurements.
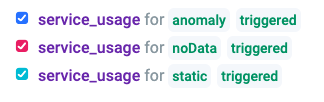
- A new service_usage metric has been added – ‘triggered‘ which enables you to see how many alerts were triggered based on type (Anomaly, static, noData)
🗃 Improvements
- We’ve improved the behavior of the ‘minimize’ functionality in triage.
- We’ve improved the filters in the alert console for Alert Assignment as well as the severity view.
- We’ve made some UX improvements to the alert console, especially around the alignment of the ‘Ack’, ‘Snooze’ buttons.
- We’ve improved the behavior when someone chooses ‘acknowledge’ from an alert assignment email.
- We improved the ‘select / clear all’ behavior when editing a graph tile and when seeing a graph tile in a dashboard.
🛠 Bug Fixes
- We fixed an issue in the Kafka agent where the send_watermark script didn’t use the proxy.
- We fixed an issue related to alert console sorting.
- Several fixes to the alert editor.
- Several fixes to the activity log.
- We’ve fixed an issue which prevented sending ‘Good’ feedback from iPhone.
- We fixed an issue which prevented duplicating Sumo Logic streams.
🌍 As usual – All the release features, beta features, upcoming features and all your feature requests can be found in our Product Portal.
Written by Yariv Zur
You'll believe it when you see it