
🎁 New Features
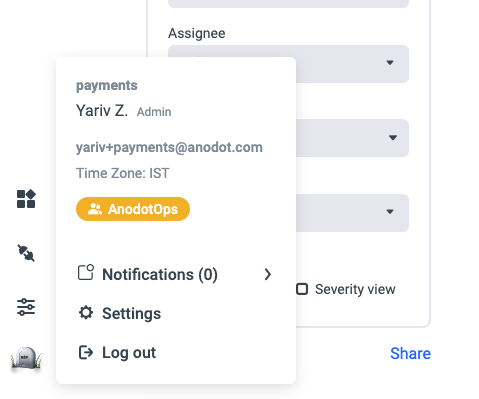
- Know those pesky “General Error” notifications which you sometime get? No more. All notifications (good or bad) will now be concentrated into a notifications panel as part of the user menu
🗃 Improvements
- Know how you can ungroup alerts by metric? This means that if we detect an incident on three different metrics – instead of one alert you will get three of them. Well, we’ve just expanded this capability to PagerDuty and email channels.
- A new version for our Grafana Plugin (4.0.4) – Which enables you to filter the alerts panel based on feedback.
- On our path to build the value reports – we keep adding building blocks which you can use. This month – Two new service_usage metrics joining the family – Actions and Licensed Metrics
🛠 Bug Fixes
- We fixed an issue which caused the “No Data Notifications” to be sent to late to admins.
- We fixed an issue which caused composites not to be calculated sometimes when RBAC is being used.
- We fixed minor UX issue in the Triage screen.
- We fixed an issue with the Google GA4 collector which caused it to handle the ‘other’ row when no filter is present.
- We fixed an issue with the Kafka pipeline which caused it stop working because of specific errors.
Written by Yariv Zur
You'll believe it when you see it