
Machine learning has been a major disruptor to analytics, but what’s behind the buzzword?
Let’s tamp down the hype a little — machine learning is a form of applied statistics. The difference is that a machine learning module can refine its output based on feedback. If a tool powered by machine learning generates a false positive, a false negative or a bad prediction, it can refine its model in order to avoid making the same mistake twice. Furthermore, machine learning models can undergo this self-improvement without user input.
Businesses see the advantage of machine learning when it comes to forecasting their revenue, identifying their most likely customers, and optimizing their networks. , Many are rapidly adopting machine learning into their workflow. Of these, 36 percent of companies claim to be early adopters, 15 percent identify as sophisticated users and the remaining 49 percent are looking into deploying ML. The results for early adopters speak for themselves.
- Amazon’s machine learning algorithm decreased their “click-to-ship” time by 225 percent.
- MIT researchers found that machine learning could be used to reduce bank losses on delinquent customers by up to 25%.
- Adobe Systems utilized machine learning to enhance its “healing-as-a-service” tool. This ultimately reduced fix times to just one minute compared to 30 minutes for fixes performed manually by humans.
Implementing machine learning is not a turnkey affair, however — you can’t just snap your fingers and have it done. Without careful monitoring, your machine learning module can return unexpected (and even embarrassing) output. For example, an error in the Google Images facial recognition software stirred an outcry after it began identifying black people as gorillas. In other words, you need to watch out in case your machine learning software develops a mind of its own.

The Machine Learning Development Cycle
Once you have decided to invest in developing ML capabilities in your organization and hired a data science team, what’s next?
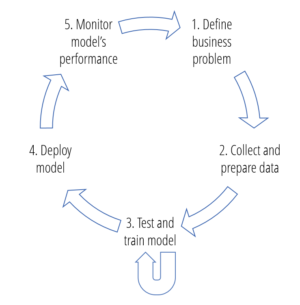
The machine learning development cycle can be described in five major steps:
- Define the Business Problem: First, you need to define the problem that you want your machine learning to answer. The problem will determine the data you gather, the model you use and the results you review. For example, you might ask, “why are our customers leaving our website without buying anything?”
- Collect and Prepare Data: The quantity and quality of the data you gather will directly determine how good your predictive model will be. From there, you’ll have to prepare your data for machine learning training, which means ordering it appropriately, splitting the data as needed, and adjusting or manipulating it (normalization or error correction).
- Train and Test Model: Machine learning can use many models, and the input data can be prepared in any number of ways.. You’ll need to test many models and transformations and choose the best performing one. The training and testing process involves comparing the predictions generated by various models and repeating the process until the best and acceptable results are achieved.
- Deploy Model: This step involves deploying the best model and data transformation to your production environment. It is then used to make predictions on real and continuous data.
- Monitor Model Performance: Many things can (and will) go wrong in the production environment. You must monitor the performance of your model in production in order to detect anomalies and prevent costly outcomes.
The diagram illustrates how these steps feed into each other.
Most available data science tools put a lot of effort into helping and automating steps 1-4, but there are few available resources for intelligently monitoring model performance, especially if there are multiple types of algorithms feeding into one another. What if your model is trained and deployed on multiple data streams in parallel (e.g., data from multiple customers, products, etc)?
While it is best practice to define a clear performance measure for each model, if multiple models are deployed, it’s unfeasible to manually monitor and track them.
For instance, teams here at Anodot designed an anomaly detection system which is applied to a very large number of time series signals. Our system runs approximately 30 different learning algorithms, each with its own parameters and tuning capabilities. These algorithms run constantly on all the signals that are sent to us by our customers (currently more than 40,000,000 reporting every 1 to 5 minutes), generating at least one model per unique signal.
How can we track the performance of these algorithms to ensure they continue to perform well? What if they work well on some data streams and not as well on others? The answer is simple – we use machine learning algorithms to track and monitor the performance of our machine learning algorithms.
We do this in two steps:
1. Measure KPIs for algorithms
We measure the number of anomalies we discover for each customer, their rank score distribution (this is based on another one of our algorithms which ranks anomalies in terms of their priorities), the number of seasonal patterns discovered, number of clusters and their quality from our various clustering algorithms, and many more. These performance measures are reported over time and can be plotted over time just like any other time series signal.
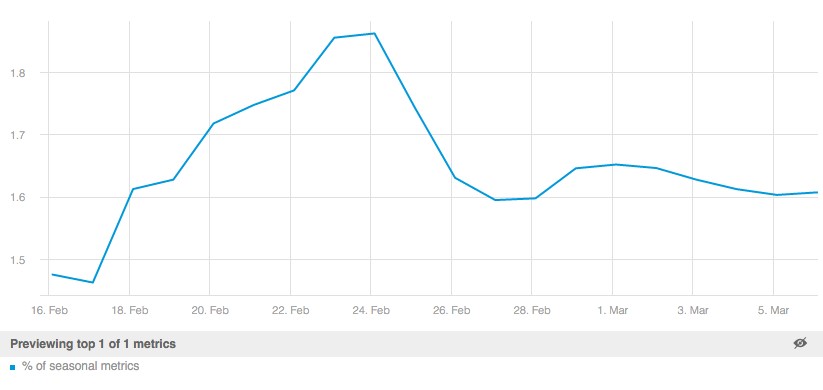 Example of time series performance measure of seasonality detection algorithm: % of seasonal metrics shown over time
2. Use algorithms that learn their normal behavior, and alert whenever they behave anomalously
Luckily for us, we did build an anomaly detection system – we just let it learn the behavior of our own algorithms through the performance metrics we collect, and alert us when they start showing abnormal patterns.
For example, when we get an abnormal change in the number of anomalies our system discovers, we can quickly determine if it was due to some algorithm tuning, a bug, or a valid shift related to a particular customer – the example below shows such a case, where an issue with one of our models caused a spike in the number of anomalies detected by the system.
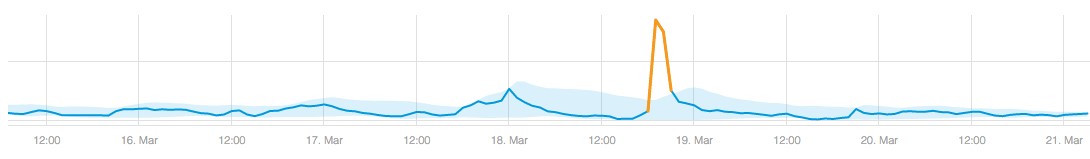
Spike in number of anomalies detected by the system caused by model issue
In another example, an anomalous change in the scoring algorithms was caused by a change in-model parameters which we deployed into production. We received an alert immediately and our data science team was able to fix it quickly.
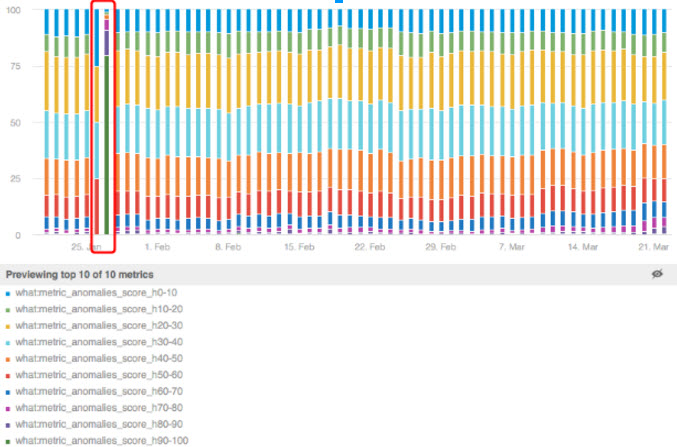
Distribution of anomaly score over time. Anomaly in distribution caused by misconfiguration error
Additionally, because we measure these performance measures at various granularities (e.g., per customer), the alerts help our data science team discover issues that may be specific to a segment of the data streams we get, allowing for quick improvements and enhancements of the specific algorithms.
For example, the behavior of certain metrics for our web business/e-commerce customers will differ from the behavior of metrics for IoT and other types of customers.
Summing it all up
The power of machine learning to extrapolate ideas, predict answers, and solve problems cannot be underestimated. However, it requires constant monitoring of your machine learning model to achieve the most accurate results. The most efficient and scalable way to do this is by setting machines to watch your machines. Once one set of machines learns the patterns of the machines that they’re observing, they can understand when their output changes in anomalous ways.
Machines can “learn”, albeit in a limited fashion, but sometimes they learn the wrong things. You can’t set and forget your machine learning modules, and if you do, you’re likely to miss anomalies that result in lost revenue, reputational damage or worse. Autonomous Analytics is an exciting way businesses are using semi-supervised machine learning to monitor massive data at scale and identify anomalies in real time.