
While checking in recently with one of Anodot’s newest clients, I got the sort of feedback that every product owner loves hearing.
I asked, “During this past month, have you been able to check alerts triggered for your region? Do you use them? Do you have any feedback?”
They replied, “The alerts are spot on. Thanks all.”
The company then went on to adopt Anodot across more teams.
So why are we so obsessed with alerts being spot-on?
Well, imagine you’re in charge of business operations for a payment company. If a larger than normal percentage of the payments are not processed, you would want to be alerted about it ASAP. Every lost transaction is lost revenue. But you don’t want to be woken up in the middle of the night by an alert that turns out to be a false positive, or has little business impact. That could ruin your morning – and potentially your marriage.
Can we reduce false positives without sacrificing the true alerts? Yes – we’ll explain how.
Machine learning coupled with simple filtering mechanisms can create a spot-on alerting system.
First, ML-based anomaly detection algorithms accurately detect abnormal behavior across different data patterns. And second, applying contextual filters on those anomalies will ensure you’re only getting alerted on issues that are actually important to you.
At Anodot, we refer to these filters as “alert settings”. We’ll cover some important settings that users can adjust to guarantee spot-on alerts..
To illustrate how these work, let’s take the following example. A business monitoring team of an eCommerce site is in charge of monitoring all aspects of revenue – in particular, the purchase funnel in the website. They decide to set alerts for monitoring:
- Example #1: total purchase revenue at any given time
- Example #2: the success rate of payment transactions
Before going into the details of each, let’s cover the attributes of an anomaly.
The attributes of an anomaly
An automated anomaly detection system uses machine learning to establish the normal patterns of time series metrics (essentially, KPIs measured over time, such as number of users, sessions, checkouts, revenues and requests). Doing it accurately and robustly is not a simple task. A full description of how to build such a system can be found here.
When a metric’s values deviate substantially from the range predicted by these algorithms for a duration of time, an anomaly is created.
Let’s take an anomaly from the Anodot platform which depicts an anomalous drop in the total value of purchases (or revenue) made on an eCommerce site.
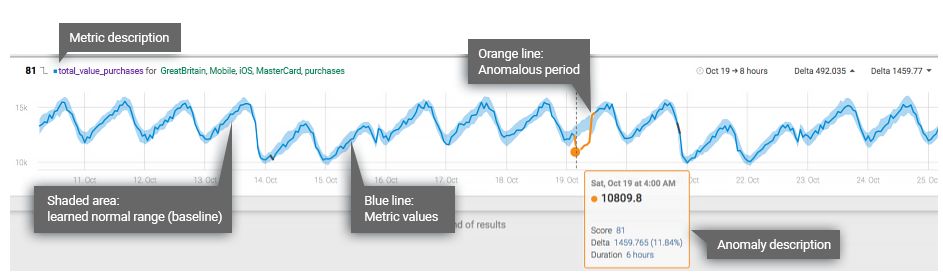
This particular metric shows the total revenue generated by users from Great Britain using iOS mobile devices. At 4 a.m. on Oct. 18, the value began to dip below the metric’s baseline (the area shaded in blue), which is the range Anodot’s algorithms predict as normal for this metric. In this case, the anomaly persisted for six hours.
This example illustrates three parameters which are key to qualifying an anomaly:
- anomaly direction – In the example above, the anomaly represents a drop in revenue from the expected range, therefore it is a down anomaly. The direction of an anomaly has an important implication on getting the right alerts, depending on the use case.
- delta – the difference between the observed anomalous values and the normal range the algorithm predicted for this metric. The delta is expressed both as a percentage and in absolute terms. At one point, the revenue dropped by 11.84 percent from the expected range, representing a drop of £1,459 from the expected revenue. These two figures are the maximum delta of the anomaly, both in percentage change and absolute value change.
- duration – the length of time for which anomalous data persists.
Anodot’s system uses these parameters and other factors to generate a score for each anomaly, and users can set alerts for each metric depending on whether a certain score is met. For example, a user may choose to receive an alert on the total purchase revenue metric only when the score meets or exceeds 75.
With or without the scoring feature, the direction, delta and duration of anomalies play an important role in helping you set up the most relevant alerts.
Setting Up the Right Conditions to Trigger an Alert
There are five primary criteria for securing a spot-on alert:
- WHAT: What should I be alerted on? At what granularity?
- URGENCY: How quickly must an anomaly be triggered?
- DIRECTION: What type of an anomaly is interesting to me? Increases or decreases in the metrics?
- DELTA: What is the minimum deviation from the normal that would matter to me, from a business perspective?
- INFLUENCING FACTORS: Are there other metrics that need to meet a certain condition before I would want to receive an alert?
Alert Settings: What Merits an Alert?
A seemingly trivial question. But it hides two decisions that should be taken. The first is whether you should use the raw KPI, or apply some normalization to it. Consider the use case of monitoring the purchase funnel of an eCommerce site. In one use case, getting alerts on anomalies in the raw amount of purchases is important, while in another, being alerted on the success rates of payment attempts is important – but that requires computing the ratio between the number of successful payments to the number of attempted payments. The anomalies of the latter may represent totally different issues and call for action compared to the first.
The second decision concerns the granularity of the KPI in question. For example, the total purchase value may be broken down to a combination of multiple dimensions, such as the product, payment method and user demographics (location, device, browser/app version, age group, etc). With greater granularity, alerts can capture even the smallest issues (e.g., an increase in payment failures for users trying to buy a particular product from a specific location, with a certain app version). In theory, knowing every single issue would be preferred – but the question is whether at that granularity there is a business justification to spend time investigating and understanding such issues.
Our experience has shown that there is a magic number of dimensions that seems to work well for many companies – choosing at most three dimensions for alerts. That level of granularity tends to be specific enough for all practical purposes. But what about the rest of the dimensions? They are typically helpful when investigating an alert that is triggered at a higher level of granularity (with just three dimensions or less).
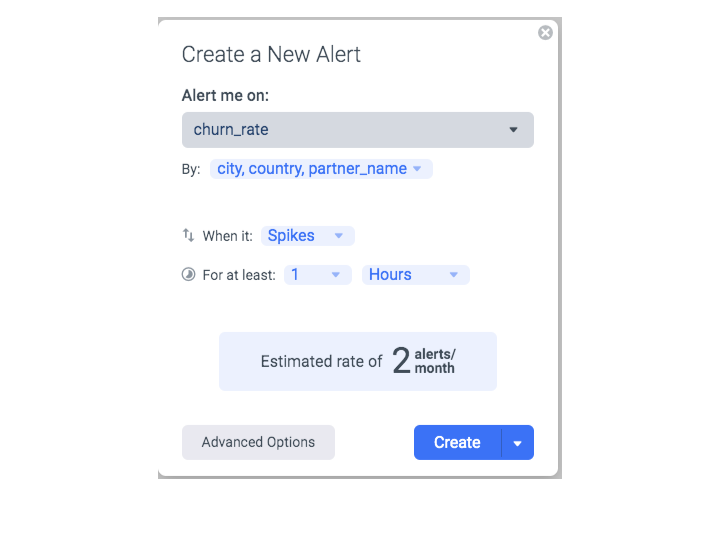
Setting an alert on the Anodot platform, we chose three dimensions to track when monitoring churn rates of a popular mobile app platform: 1) anomalous spikes in churn rate for each city, country and partner combination that 2) last for a minimum of one hour. Our algorithms predicted that, based on this customer’s data, these settings would trigger approximately two alerts per month.
Alert Settings: Urgency
The next choice is really a business one – how quickly must an anomaly trigger an alert? It sounds like a silly question – isn’t the answer always ASAP? Not necessarily. There are two factors to consider:
- The business impact of the anomaly.
- For example, a short anomalous drop in purchase revenue of a single product may not be worth chasing after, but if it lasts for a longer period, it becomes worthwhile. While a short drop in all purchase amounts for a country is worthy of the analyst’s time immediately.
- The time it takes to handle an anomaly.
- For instance, when observing a drop in successful payments for a credit card, let’s say Visa, the resolution path may include contacting Visa so they can check their systems. This may take several minutes to hours. Therefore, before initiating this process, the analyst may want to see that the drop is not a short glitch that fixes itself.
Based on these factors, there are two parameters to set in an alert: the time scale at which we’ll track the KPI, and the minimum duration an anomaly should persist before triggering an alert.
What is this “time scale”? We can apply the anomaly detection algorithm to multiple versions of the same metric, aggregated at various time scales. At Anodot we chose five time scales: one minute, five minute, hourly, daily and weekly aggregations. While in an ideal world we should detect any anomaly at the lowest time scale possible – reality is that the lower the time scale, the noisier the time series (remember the law of large numbers?), making it harder to learn the metric’s behavior. Additionally, slow moving trend changes are harder to capture at lower time scales.
So, the best practice is to choose the highest time scale that meets the urgency criteria for the use case. If you won’t react to drops in purchase amounts for a product in less than an hour, choose to alert on the hourly version of the metric and not the one-minute version.
The same goes for choosing the minimum duration of an anomaly. Selecting a shorter duration than required can lead to alerts that are deemed false positives. Often times with these kinds of alerts, you’ll wait anyways to see if it reaches a certain duration for fear of wasting your time on an insignificant flux in data.
Let’s revisit our two examples of eCommerce metrics. Anomalies in the total value of purchases for a particular product (out of thousands of products) will typically be interesting at the hourly, and sometimes daily, time scales, with a duration of a few hours to a day. While anomalies in the success rates of payments for a popular credit card company are typically worth investigating after 10-20 minutes (not shorter, because the credit card support won’t be fast enough to react)/Using the 5-minute time scale is appropriate with a 10-minute minimum duration.
Alert Settings: Choosing the Relevant Anomaly Direction
Every anomaly has essentially two directions – a drop or increase in the value compared to normal. Depending on the measure, the primary direction of interest will change. The typical anomaly alert direction can be split as follows:
- failure rates, response time – the typical direction of interest is an INCREASE (UP)
- transaction volume, success rate – the typical direction of interest is a DECREASE (DOWN)
- other types of statistics – the direction depends on context (see table below for examples)
Going back to our two examples, the most interesting anomalies for the total purchase revenue is a drop. While spikes in revenue may be interesting in some cases (e.g., fraud or price glitch), they are a secondary factor to consider. The most interesting anomalies in transaction success rate is also usually a drop (an increase is secondary). If measuring the rate of unsuccessful credit card payments, a spike in the decline rate would be the direction of interest.
While there are metrics where anomalous activity in either direction would be of interest, they’re not usually equally critical. An anomalous drop in payment success rate is typically much more urgent than an unusual increase in success rate – therefore the sensitivity in the alert settings should be different.
Table 1 lists the five main types of metrics that warrant alerts, including examples and the recommended direction of interest.
TABLE 1
| Alert Type | Description | Example Measures | Recommended Direction |
| Volume | An alert on changes in volumes of important business metrics. |
|
DOWN |
| Conversion Rate or Success Rate | An alert on the rate of conversion for a business process or activity. |
|
Main: DOWN
Secondary: UP – to detect “fraud” (e.g., click fraud, bot activity, price glitch) |
| Average Quantity
(or some stat) |
An alert on the average (or some other statistics) for a set of measurements. |
|
UP or DOWN
|
| Failure Rate | An alert on the rate of failures of a process |
|
Main: UP
Secondary: DOWN – to detect potentially broken processes – e.g., a significant drop in credit card decline rate might indicate the fraud detection process is broken) |
| Outcome Distribution | Alert on changes of distribution in multiple outcomes of a process.
The distribution change helps identify changes of behavior when there are multiple outcomes – whether at application level (errors) or at product level (type of users, type of purchases). |
(percent of http error 500 vs percent of error 400, etc)
|
UP and DOWN |
Alert Settings: Setting the Minimum Delta
How big of an anomaly should occur before you get an alert?
Each anomaly is characterized by the amount of deviation from the normal range, aka the delta. The delta is described with two numbers which are both important in the alert settings:
- absolute delta – computed as the absolute difference between the expected normal value and the actual anomalous value.
- percentage delta – computed as the absolute delta divided by the expected value.
The first factor in setting the delta is the business impact of the anomaly: if the alert is for all of the purchase amounts of the entire eCommerce site, even a one percent anomalous drop may be very important, while alerts on the purchase amounts per product and country may be interesting only if the change is at least 10 percent.
Beyond the business impact factor, we have found that when alerting on a single measure, as a rule of thumb, setting your delta to a minimum of 10 percent filters out most insignificant anomalous behavior.
But what if you configure alert settings for many instances of the measure? For example, an alert on the purchase revenue per product and country may have thousands of combinations, one for each combination of product and country.
Is the 10 percent rule of thumb enough? Typically not. To illustrate why, let’s look at the following example. The figure below shows the top 50 metrics, each representing the total number of purchases per product and country for a large eCommerce site. It is easy to see that their scale is very different – in some combinations there is a high volume of purchases while others have a very low volume.
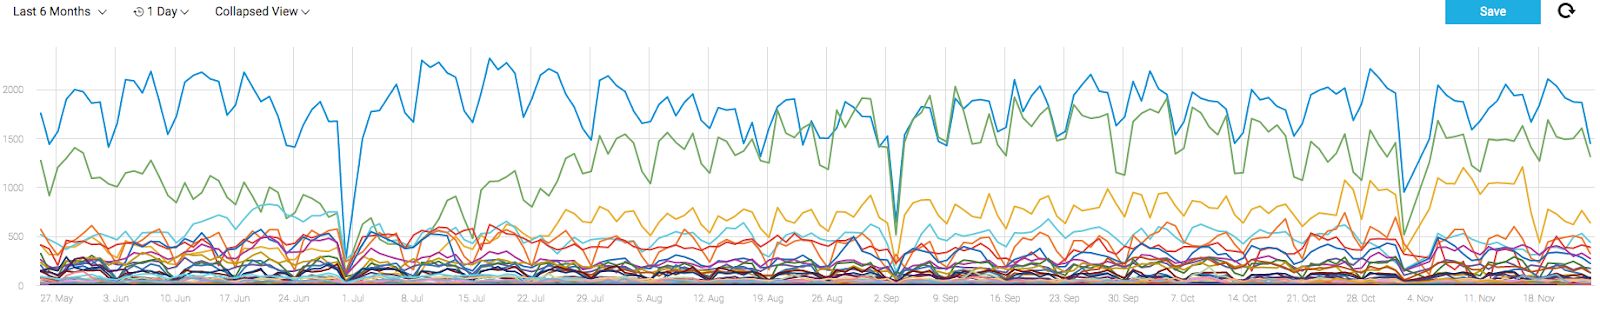
Using the 10 percent minimum delta rule of thumb gives equal weight to all of these combinations – a 10 percent drop may indicate a drop from purchase amount of 1000 to 900 for a popular product/country combination. But in the case of less popular products, it would also set off an alert if there was a drop from 10 to nine. A drop this small is not really an actionable anomaly, and the ensuing alert would likely be deemed a false positive. This is why you’ll also want to set a minimum absolute delta, to filter out the anomalies where the drop, in absolute terms, shouldn’t trigger any alert (e.g., a drop of one – from 10 to nine).
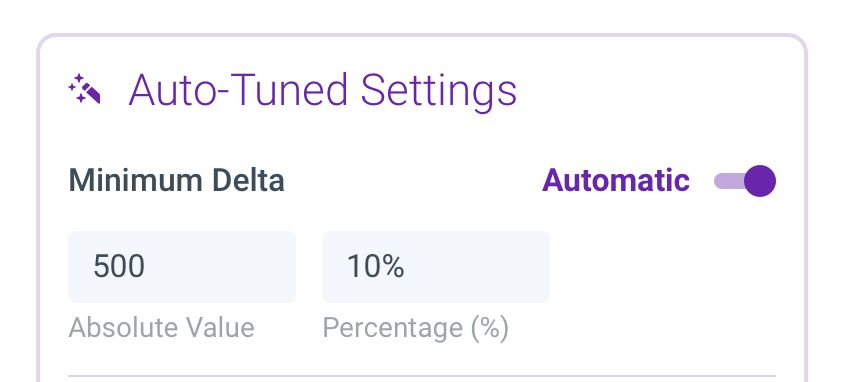
In the Anodot system, we’ve designed an algorithm for automatically determining the minimum absolute delta. But even without an automated algorithm, you’ll want to set this value in order to filter out the false positives. Below is an example of such a condition applied on purchase revenues per country, ensuring an alert is fired only if anomalous data has a delta that meets or exceeds $500 and 10 percent of the normal expected purchase revenue.
Alert Settings: Influencing Factors
Imagine you were woken up at 4 a.m. by the following alert: The success rate in credit card payments dropped anomalously by 50 percent for a particular card in country X. When would you jump out of bed, and when would you just snooze the alert and go back to sleep?
If country X has a large volume of business for your company, you would jump out in a panic to figure out why it happened. But if it was a country that provides very little business, you might just fall back asleep, cursing your alerting system.
Sometimes there are other measures that influence whether an anomaly is actionable. In this example, the volume of business (revenues or transactions) influences whether a drop in transaction success rate is a critical issue.
In cases where the metric represents a ratio of two volume measures, the metric in the denominator of the ratio should (almost) always be used as an influencing factor. Examples are abundant:
- payment transaction success and failure rates
- click-through rate (CTR = clicks divided by impressions)
- page bounce rates
- generally any type of funnel conversion rate
If the volume entering the funnel is low, drops in conversions won’t likely be as significant. If you were monitoring an ad campaign for instance, you’d be much more interested in a 50 percent drop in CTR if the number of impressions was high (e.g., 10,000), but much less so if impressions were low (e.g., 25).
As a rule of thumb, whenever you alert on metrics representing ratios, the denominator should be used as an influencing factor, helping you to filter out anomalies that occur when there are low volumes. Similarly for derived statistics, that depends on the volumes (e.g., averages, medians, etc). The filter on the influencing factor should apply to the time when the anomaly occurred – that is to say: alert me when the transaction success rate drops, but only if the volume of the attempted transaction was higher than X during the anomaly. We have seen that this is the most common influencing factor to reduce irrelevant alerts.
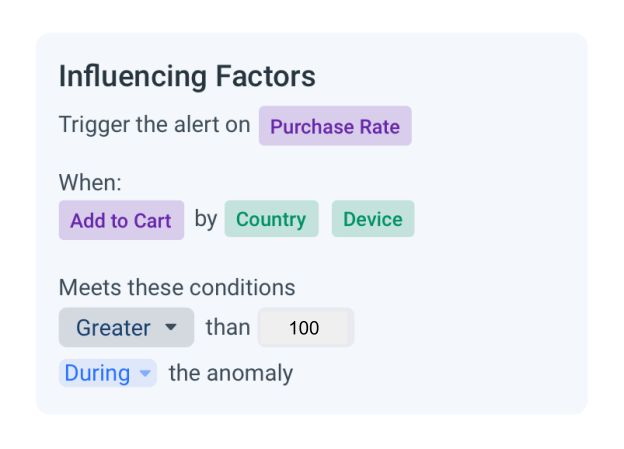
The example below illustrates a condition placed on alerting for purchase rates (number of checkouts / number of add to carts), based on the user’s country and device. An anomalous decrease in purchase rates will trigger an alert only if the number of add to carts is greater than 100 during the anomaly. This setting ensures that you get alerts when there’s an unusual drop in purchase rate, but filters out instances when the purchase volume is also low, and presumably not something you’d normally care about.
The second most common influencing factor is a general volume metric representing some global quantity of business value. For example:
- an alert on ad campaign clicks or impressions may be interesting only for campaigns that have an average daily spend of more than $1,000
- an alert on product revenue per country may be interesting only for countries and products that have at least 1,000 visits per day
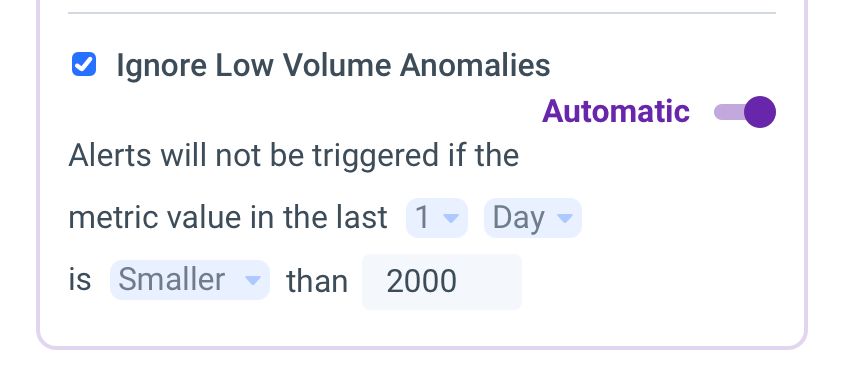
In such cases, the influencing factor is not the volume during the time of the anomaly, but rather the volume beforehand – the normal range. Below is an example of this influencing factor applied to an alert measuring purchase revenues per country. It will trigger on anomalies only if the revenues for that country meet or exceed $2,000 in the day before the anomaly.
Summary
An anomaly detection system can detect all anomalies in any time series metric, at any granularity. To make alerting on these anomalies spot on, further filtering is required in order to provide business context. Try adjusting the five criteria mentioned (choosing which metrics and at what granularity, urgency, direction, delta and influencing factors) to generate alerts that prove more relevant and actionable.


