
“Watch the little things; a small leak can sink a great ship!”
– Benjamin Franklin
Small and slow leaks sink ships – by analogy, slow and small leaks can also cause significant losses for any business if not detected and fixed early.
Are small leaks interesting? Suppose an eCommerce business sees a decline of 50% of purchases in the last day – the entire company would be called in – from the CEO all the way to R&D, Support, to figure why it happened as quickly as possible. Now suppose there is a 1% decline seen in revenue in the last day – most likely nobody would even notice. But, if there is a 1% decline every day, it would take just 2.5 months for revenue to drop by 50%. At what point would it get noticed? After just two weeks, revenue would already drop 13%, and 27% after a month. If missed or overlooked, the damage can be just as big as a major outage.
What are some examples of slow business leaks?
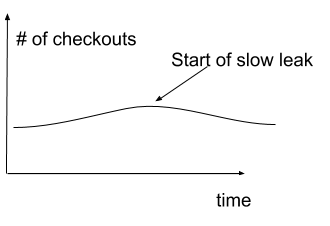
- A bug in an important business process (e.g., checkout or ads displayed) after a new release for a particular platform and OS version. At first, few users are affected, but as more users download the new version, the leak becomes a flood.
- A slow degradation in optical fibers’ transmission power slowly reduces the bandwidth supported by those lines, leading to network capacity issues impacting customers.
- A change in a marketing campaign causes a decline in conversion rate for a certain segment, going unnoticed for a long time, leading to loss of leads/customers.
- A competitor improved their ad targeting strategy, winning more ad bids, causing a gradual decline in your ad views and conversions.
- A gradual degradation in application performance causing webpages to load with increasing delays.
- A confusing UI/UX change of an important feature causes a slow and gradual reduction of feature usage and a slow increase in churn, as frustrated users stop using the product.
- A change in your business’s customer support playbook leads to increase in ticket handling time, slowly increasing support costs.
- And more….
What do these leaks look like?
For each example above, the leak should be visible in at least one KPI (metric) that is being measured. For example, metrics measuring usage of a feature, number of checkout completions, or churn rates should show gradual declines or increases. These leaks typically appear as a change in trend in the metrics – revenues, conversion rate, etc.
But, there are two problems in detecting these slow leaks before ship sinks…
First, manual inspection of all the relevant metrics is just not feasible – there may be thousands to track, especially when measuring each KPI in different segments: e.g., the number of checkouts is measured for various segments of the user base, for different OS and device types, etc. The slow leak may occur in any one of these, and might not show up at an aggregated level at all.
Second, slow leaks may be hard to notice in the graph unless you look at a large enough time window, and the time scale (aggregation level – hourly, daily, etc.). But what is large enough? A day? A week? A month? What is the right time scale?
Multi-Scale Anomaly Detection
Anomaly detection for time series involves learning the normal behavior of a time series and detecting significant deviations as anomalies.
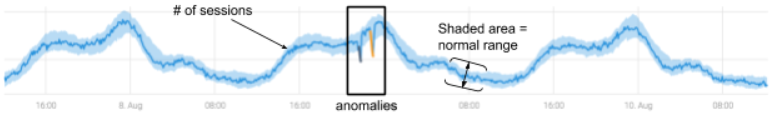
The figure below shows a time series measuring the number of sessions, and two anomalies showing a drop compared to the normal pattern:
In our Definitive Guide for Building an Anomaly Detection System, we described the makings of a robust and large-scale anomaly detection system.
Assuming there is an anomaly detection software on hand, we can apply it for each metric we collect at multiple time scales – e.g., the number of crashes every minute, hour, day, and even week.
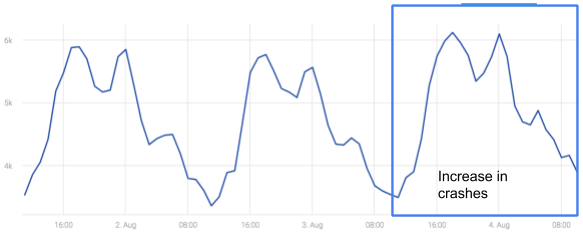
Let’s examine a real example involving a popular mobile app. The graph below represents the total number of mobile app crashes, measured for all users (all geographies, platforms, and versions of the app):

There is a clear daily pattern of “crashes”, but there is no visible change in the trend of the total number of crashes.
However, there was a gradual increase in the number of crashes on iOS-based devices using a particular version. When viewing the crash metric for iOS and the problematic version at an hourly time scale, it is hard to notice the change on the first day when it started increasing:
Even though the number of crashes increased, if one was to look at a dashboard at this graph, at the hourly time scale, the leak would go undetected until it grows much bigger.
So, how can we quickly detect the slow leak (increase in crashes) in this case? Let’s change the time scale – let’s look at the daily aggregation of the number of crashes:
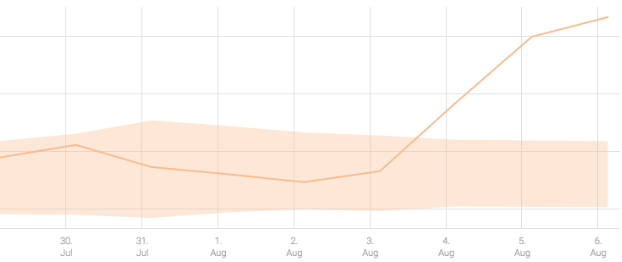
With each data point representing the total number of crashes per day, it is easier to see that Aug 4th looks higher than before and there is a potential trend change.
Both of these challenges illustrate that manual detection of the leak would require significant effort by an army of analysts, who would have to constantly circulate through at least thousands of graphs, view them at multiple time scales, and hope to pick up on such cases. And even then – is it that obvious that the higher crash numbers represent a meaningful increase? If left unresolved, the slow leak could eventually become a flood.
There is a better solution – machine learning based, multi-scale anomaly detection. Anodot’s algorithms detected the anomaly by automatically analyzing the same metric (number of crashes for iOS devices and one version of the app) at multiple time scales. Although the leak was slow at the hourly time scale, and did not cause any one hour to be anomalous, it showed up as a significant anomaly at the daily time scale, enabling early detection.
Is multi-scale analysis really necessary? The adaptation/detection tradeoff
We could argue that if we waited a day, the leak would show up on the hourly timescale. However, it might never get detected at the hourly timescale. All known methods for modeling time series for anomaly detection (from ARIMA, Holt-Winters, LSTMs, etc), estimate trends as part of the process of learning the normal behavior and must be adaptive to small changes in the time series behavior. Adaptiveness is critical when measuring businesses, as nothing is static. This means that if the leak is slower compared to the rate of adaptation of the learning algorithm, the algorithm will constantly track the leak as a normal change of behavior.
The figure below illustrates how the normal behavior algorithm adapts to a slow downward trend in a metric measuring number of sessions:
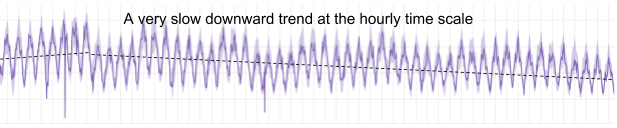
The same metric at the daily level registers an anomaly when the trend changes – thus enabling detection of the change in trend.
To summarize, detecting slow leaks is nearly impossible if done manually. Anomaly detection algorithms are well suited to detected changes in the time series normal behavior – but because slow leaks may still “hide” under the noise and need for adaptation by these algorithms, a multi-scale approach ensures that the slow leaks are detected.
Anodot’s real-time anomaly detection system analyzes each time series at five time scales: minute, 5 minutes, hourly, daily and weekly. These time scales cover a wide range of possible anomalies and slow leaks, ensuring that both the big and sudden anomalies are detected, as well as the more subtle and slow leaks are detected – making sure that the ship never sinks.


