
Customers today are faced with a wide variety of industry terminology: APM, IOTA, BPM, OI, BAM and AIOps, just to name a few. Using different terminology like this might help large vendors expand their market size with different positioning offerings, but it certainly doesn’t help their customers understand what they’re getting. Companies spend tens of millions of dollars to solve their problems with the wrong solutions and struggle to get value from it.
The 5 Whys of IT Monitoring
The 5 Whys help us rethink and understand why companies use so many monitoring tools.
When it comes to IT monitoring, for example, let’s say you’re monitoring server system metrics (CPU and memory):
- Why? To make sure those servers are functioning correctly.
- Why? To make sure the applications running on those servers are functioning correctly.
- Why? To make sure your customers are getting the right service.
- Why? To keep your business healthy.
- Why? So you don’t lose revenues.
Now let’s run the same practice for APM, and assume that you’re monitoring your application:
- Why? To make sure the applications are running properly.
- Why? To make sure your customers are getting the right service.
- Why? To keep your business healthy.
- Why? So you don’t lose revenues.
Once you determine the answers to those questions, additional questions might follow:
- Why do you need so many tools? (After all the root issue is that you don’t want to lose revenue).
- If you monitor your applications anyway, do you really need to monitor your machines?

So why don’t you monitor your revenues?
To answer that question, we need to better understand the evolution of the monitoring space and the technologies that have evolved to allow more sophisticated and accurate ways to monitor.
Twenty years ago, the cloud didn’t exist. Companies used colocation hardware, servers, routers and load balancers. Most of the applications involved C and C++ coding, PHP and services with challenges such as memory and file descriptor leaks. These problems required long nights of dealing with downtimes, troubleshoot and maintenance.
With the evolution of application servers based on Java, Ruby and Python virtual machine-based coding, APM companies grew rapidly. They were able to provide more visibility into the developed code. It’s simple to install agents to have a better and deeper understanding of what was happening. The application layer monitoring is much closer to the revenues layer, reflecting a better and more accurate reflection of their business health.
Companies that moved to the cloud reduced their dependency on system monitoring, routers and balancers. Even CPUs are not their concerns anymore. The evolution of Kubernetes, containers and autoscale has changed the game even more.
This has all led to what could be called a ‘golden age’ for APM companies. Even the smallest of companies of today have the resources and the ability to collect a huge amount of data. We are required to provide higher standards of churn, retention and growth based on data. Now more than ever, we should rethink our monitoring strategies. This is the right time to adopt a ‘top-down’ approach where we detach ourselves from the old way of doing things, with revenue monitoring first.
A Top-Down Approach to Monitoring
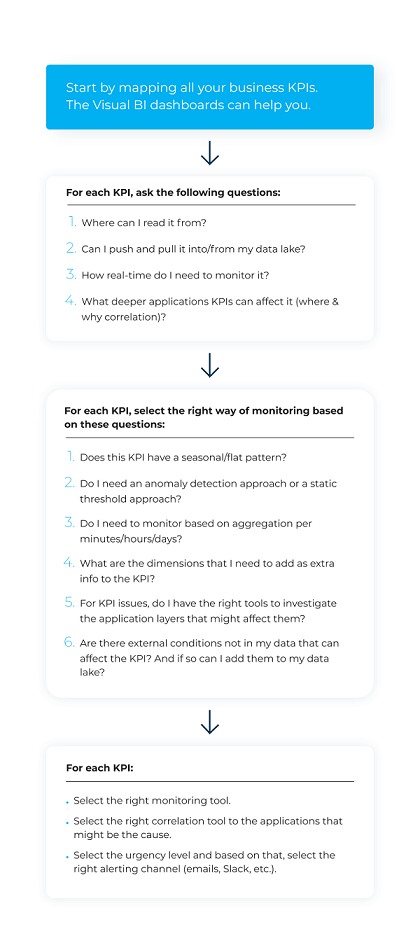
By understanding the history of the monitoring space, you can focus on your main goal: preventing revenue loss. To understand how to monitor your revenues you first need to map the main KPIs that affect your revenues. Most of those KPIs already exist in your BI analytics and data lakes.
Once you’ve done that, the next step is to understand the speed of your business. Is it real-time? Daily? Weekly? If it’s real-time, you will need to shift into a streaming approach and get your data from queues such as Kafka or other queues that your cloud vendor offers.
After you’ve mapped your business KPIs and you have the right tools to monitor them (either with an in-house Business Activity Monitoring or other anomaly detection solution), the next question is where are your lost revenues coming from?
APM or log solutions are a great way to visualize your existing data; however you may not want to duplicate all that data from your data lake into those solutions. Going forward there will likely be many more monitoring tools that will directly analyze and visualize from the data lake itself and not require a massive investment in solutions like those.
The top-down approach to monitoring, therefore, requires a new way of thinking. As an early adopter, you can think differently, quantify your incidents and bring dollar value to any improvement.
Conclusion
Today we’re seeing huge market technology changes in the monitoring space. We are not yet in a utopia by any means, and we will still see a rise in certain monitoring companies and the fall of others. The shift to the cloud has totally changed the rules of the game. Legacy monitoring solutions are not meeting the new industry standards of scale accuracy and speed, and therefore HP, BMC and CA (Broadcom) are no longer dominant in the industry.
It doesn’t stop there however, with data and AI becoming the next game-changers. The move to a top-down data approach and auto-remediation with AI are the native evolutions to come in this ever-changing industry.
Written by David Drai
Ready to see our solution in action?
Prepare to see how Anodot leverages AI to constantly monitor and correlate business performance, identify revenue-critical issues, and provide real-time alerts and forecasts.