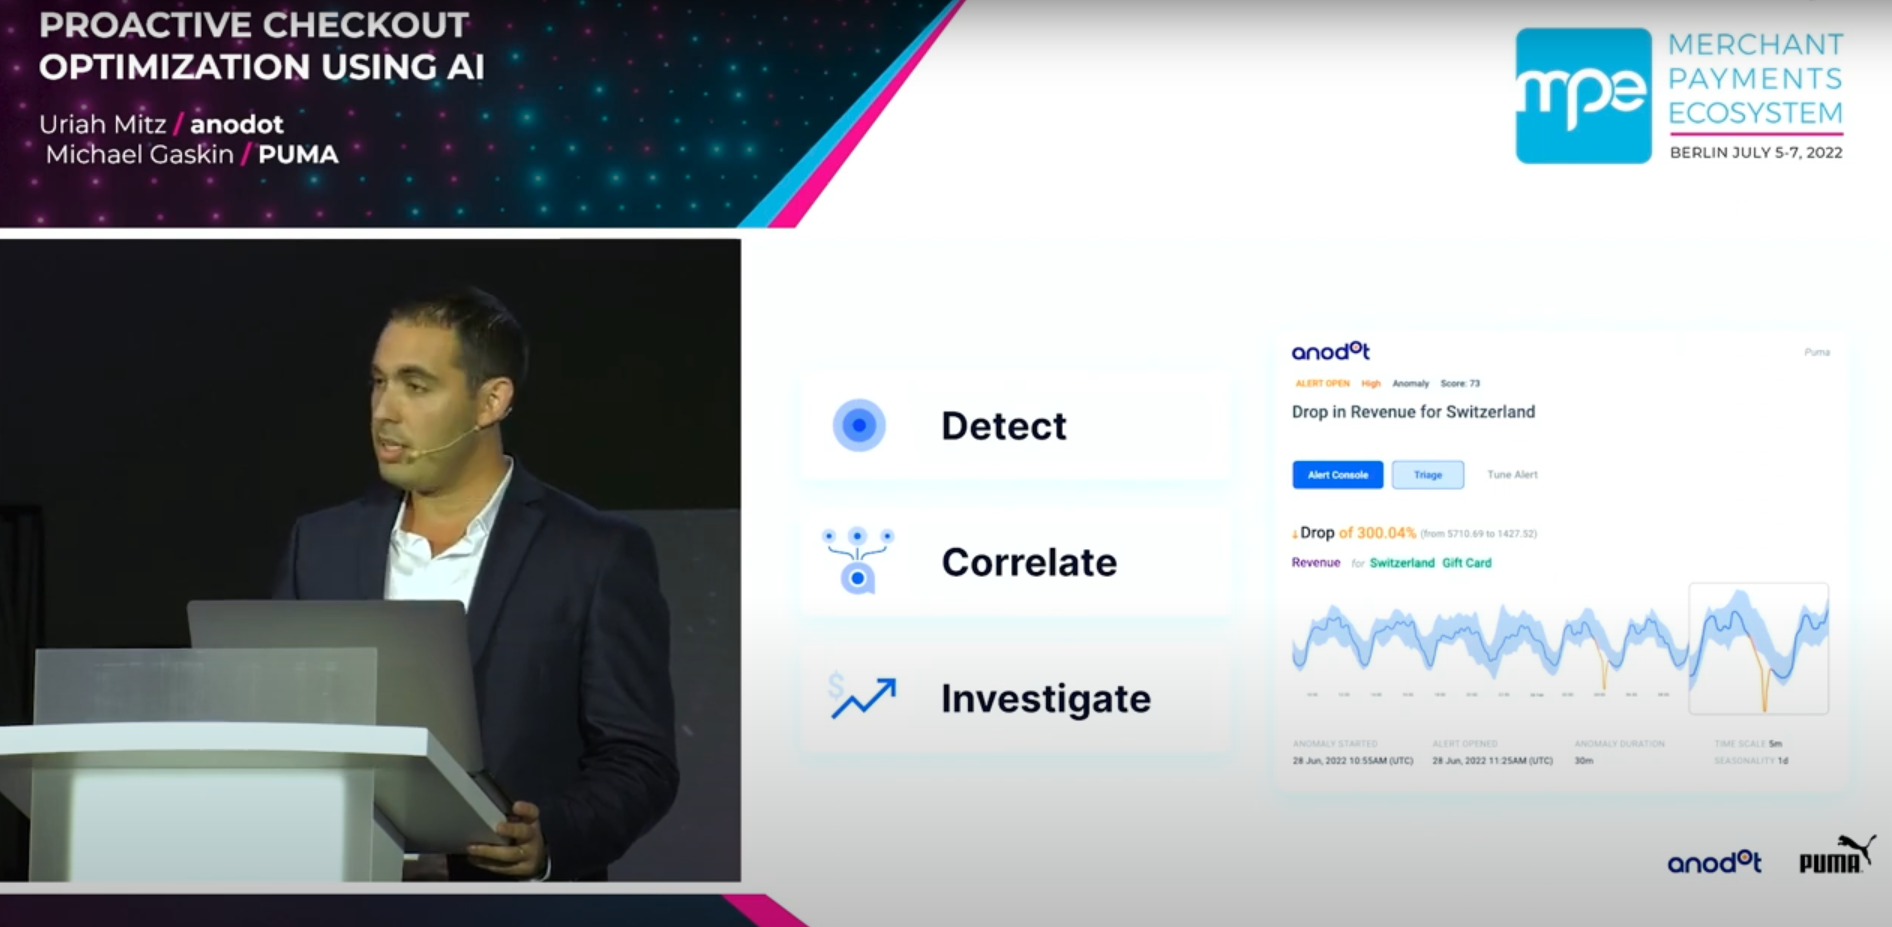
Anodot vs. Databricks Built Monitoring
Audience: Data, Operations, and Product leaders evaluating anomaly detection/monitoring platforms vs. a Databricks‑native build
TL;DR
- Anodot delivers turnkey, low‑noise anomaly detection with cross‑metric correlation, significance scoring, event-aware baselines, and an incident UX at enterprise scale.
- Databricks‑built solutions can reach high accuracy using your choice of models and Spark‑scale pipelines, but you must assemble feature engineering, training/retraining, correlation logic, alerting, and the incident workflow.
What “quality of monitoring” means
- Signal vs. noise: Anodot groups related anomalies into a single incident and ranks by significance to reduce alert storms; Databricks requires custom rules/joins to correlate signals from multiple metrics.
- Seasonality & events: Anodot baselines adapt to hourly/daily/weekly patterns and influencing events (e.g., holidays, launches). In Databricks you engineer features (calendars/promotions), choose models (Prophet/ARIMA/LSTM/Isolation Forest), and manage retraining.
- Context & RCA: Anodot’s incident view links correlated anomalies and contributing factors with optional business‑impact estimates. In Databricks you compose dashboards (Databricks SQL/Lakeview) and join detections back to dimensions/events.
Head‑to‑head summary

Example use cases (non‑industry specific)
- Traffic & conversion funnel – Detect drop in conversion in a specific region/browser version; correlate with latency spikes and a deployment event → one incident with priority.
- Data pipeline health – Spike in late‑arriving records in a bronze table; correlate with upstream API errors and streaming backlog.
- Cost & usage anomalies – Sudden increase in compute hours for a single workspace; correlate with schedule changes and job failures.
In each case, Anodot (a) learns normal per segment, (b) correlates co‑moving anomalies, and (c) provides incident context/impact to accelerate RCA.
Time to value
- Anodot: Connect Snowflake/Databricks/DBs/streams; auto‑discover metrics/dimensions; start baselining immediately; first alerts in hours/days.
- Databricks build: Data modeling → feature pipelines (DLT/Jobs) → train/evaluate (MLflow) → batch/real‑time serving (Mosaic AI Model Serving) → Databricks SQL Alerts → triage UX (dashboards or custom app).; first alerts in weeks to months
Maintenance & ownership
- Anodot: Managed retraining for seasonality &drift; correlation/noise reduction; alert routing to Slack/PagerDuty/ServiceNow/JIRA/Opsgenie.
- Databricks build: Manage clusters, orchestration (Jobs/DLT), model registry/serving, drift monitoring, schema changes, alert logic, and dashboards.
Capabilities not native to Databricks (you must build them)
- Cross‑metric correlation & incident grouping
- Significance scoring to prioritize incidents
- Holiday/event‑aware baselines (influencing events)
- Impact‑value estimation in‑alert
- Turnkey incident UX with noise controls
When a Databricks build can make sense
- Need highly customized modeling or governance flows within Lakehouse.
- Narrow scope (limited metrics/sources) or exploratory R&D.
- Strong preference to keep all logic in‑house and staffed platform/ML teams.
Architecture options
Hybrid: Keep data in Databricks Delta; connect Anodot for detection/correlation; send incidents to collaboration/on‑call tools. Preserves data‑residency while accelerating TTV.
References (selected)
Anodot
• Incident correlation & noise reduction: https://www.anodot.com/incident-detection/
• Influencing Events (event‑aware baselines): https://support.anodot.com/hc/en-us/articles/360017086719-Influencing-Events
• Events overview (types incl. suppress/office hours): https://support.anodot.com/hc/en-us/articles/209776765-Events-Overview
• Integrations & alert channels: https://support.anodot.com/hc/en-us/categories/201105765-Integrations
• Scale & system paper: https://proceedings.mlr.press/v71/toledano18a/toledano18a.pdf
• Platform case study: https://www.intel.com/content/dam/www/central-libraries/us/en/documents/2022-12/anodot-case-study.pdf
Databricks
• Databricks SQL Alerts: https://docs.databricks.com/sql/user/alerts/
• Anomaly detection (data quality monitoring): https://docs.databricks.com/data-quality-monitoring/anomaly-detection/
• Delta Live Tables (pipelines/orchestration): https://www.databricks.com/discover/pages/getting-started-with-delta-live-tables
• MLflow model lifecycle & registry: https://docs.databricks.com/mlflow/models
• Workspace/Unity Catalog model registry details: https://docs.databricks.com/machine-learning/manage-model-lifecycle/workspace-model-registry
• Mosaic AI Model Serving (real‑time): https://docs.databricks.com/machine-learning/model-serving/
• Batch inference patterns: https://docs.databricks.com/machine-learning/model-inference/
Recommendation: For broad, reliable monitoring with quick TTV and minimal upkeep, choose Anodot—optionally via a hybrid pattern to keep Databricks as your data plane while Anodot handles detection, correlation, and incident workflow.