Telecom companies monitor their network using a variety of monitoring tools. There are separate fault management and performance management platforms for different areas of the network (core, RAN, etc.), and infrastructure is monitored separately. Although these solutions monitor network functions and logic – something that would seem to make sense — in practice this strategy fails to produce accurate and effective monitoring or reduce time to detection of service experience issues.
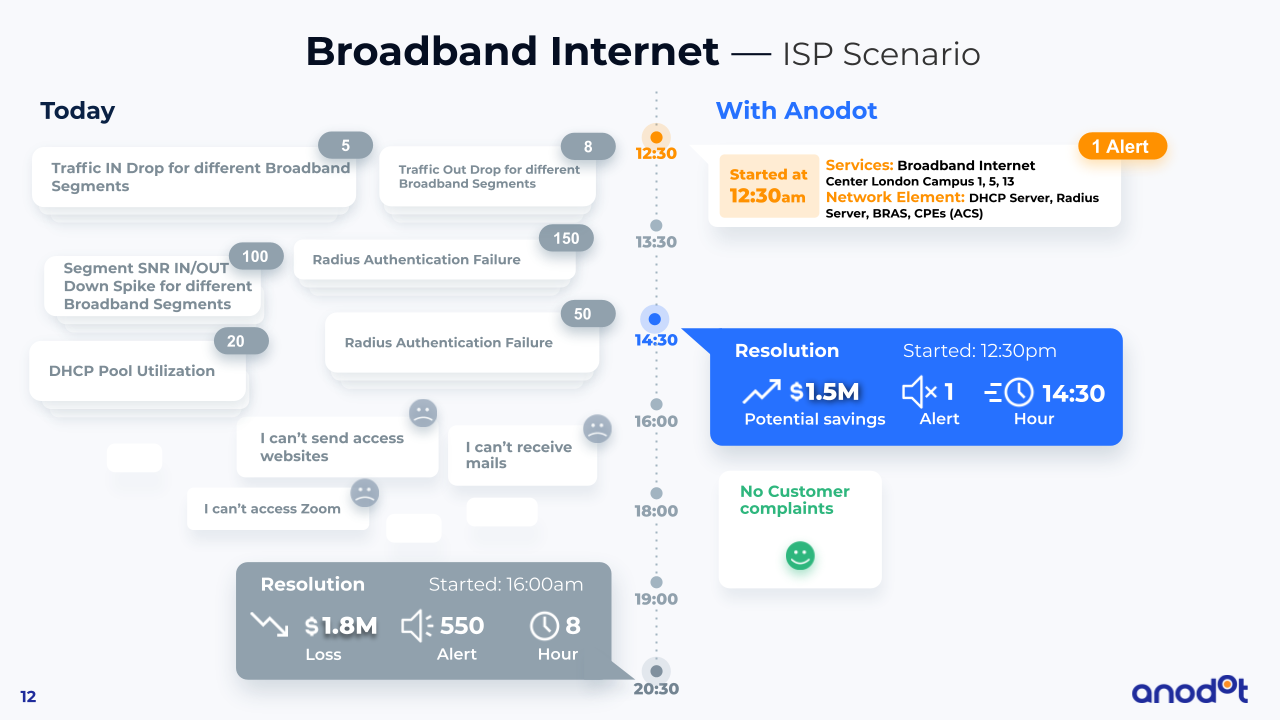
The main reason for this dramatic shortcoming is that these tools can’t detect service impact and experience faults. They monitor the network in silos — every network layer as a stand alone and every network type differently — and utilize rule-based or static thresholds. Due to thresholding limits alert storms are common, or alerts aren’t generated. The siloed approach prevents effective correlation between related issues. As a result, the NOC team’s only way to understand the actual service impact and experience is by collecting customer complaints and looking at “downdetector”, which typically takes anywhere from a few hours to a few days, resulting in significant revenue loss and damage to brand reputation.
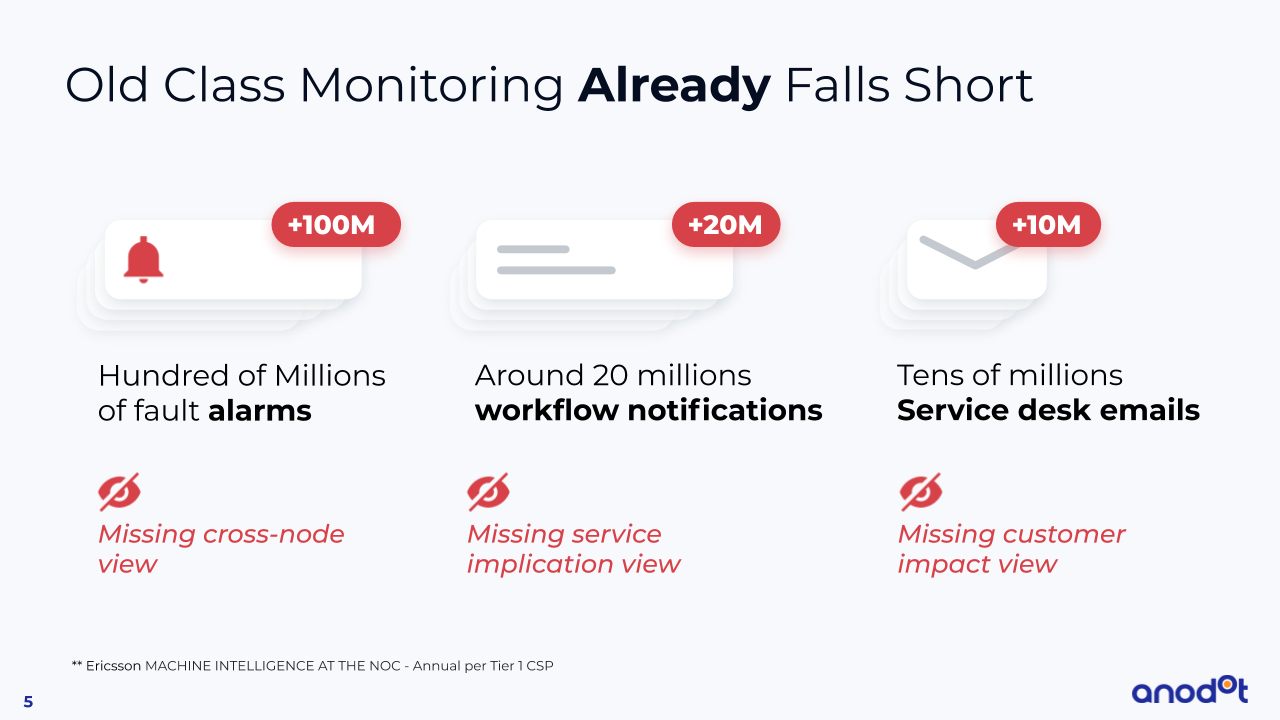
This Ericsson report clearly relates the story: with old class monitoring, the huge volume of alarms, notification and emails is missing the cross node view, the service implications view and the clear understanding of what is the real impact on the customers — all needed for rapid resolution. Typical NOC alarm processing involves mapping of incoming alarms to incidents using enrichment, aggregation, de-duplication and correlation techniques. It is challenging due to the heterogeneity of alarm information stemming from the multi-technology, multi-vendor solutions used in today’s telecom networks. This heterogeneity makes it difficult to create a harmonized view of the network and significantly increases the complexity associated with fault detection and resolution. In a changing world where customer experience is one of the most important KPIs – missing this view is challenging and impacts the customer experience. It also increases the dependencies on network experts and the costs related to the low rate of workflow management utilization.
These trends require CSPs to shift priorities and move to fully autonomous service experience monitoring that delivers real competitive edge. That’s why leading companies are adding another layer on top of network monitoring, using AI-based real-time Service Experience alerts for proactive monitoring of their customer’s experience. Real-time service experience monitoring creates a holistic view of the network, breaking down silos and correlating across 100% of the data. It ensures lightning-fast detection of the incidents that impact your customers and revenue so that you can scale quickly and deliver great customer experience at the same time.
What is service experience monitoring
CSPs need to understand how their network is utilized by their customers and how customers experience the network and services — two factors that are major influencers on CSP revenue, business value and future growth.
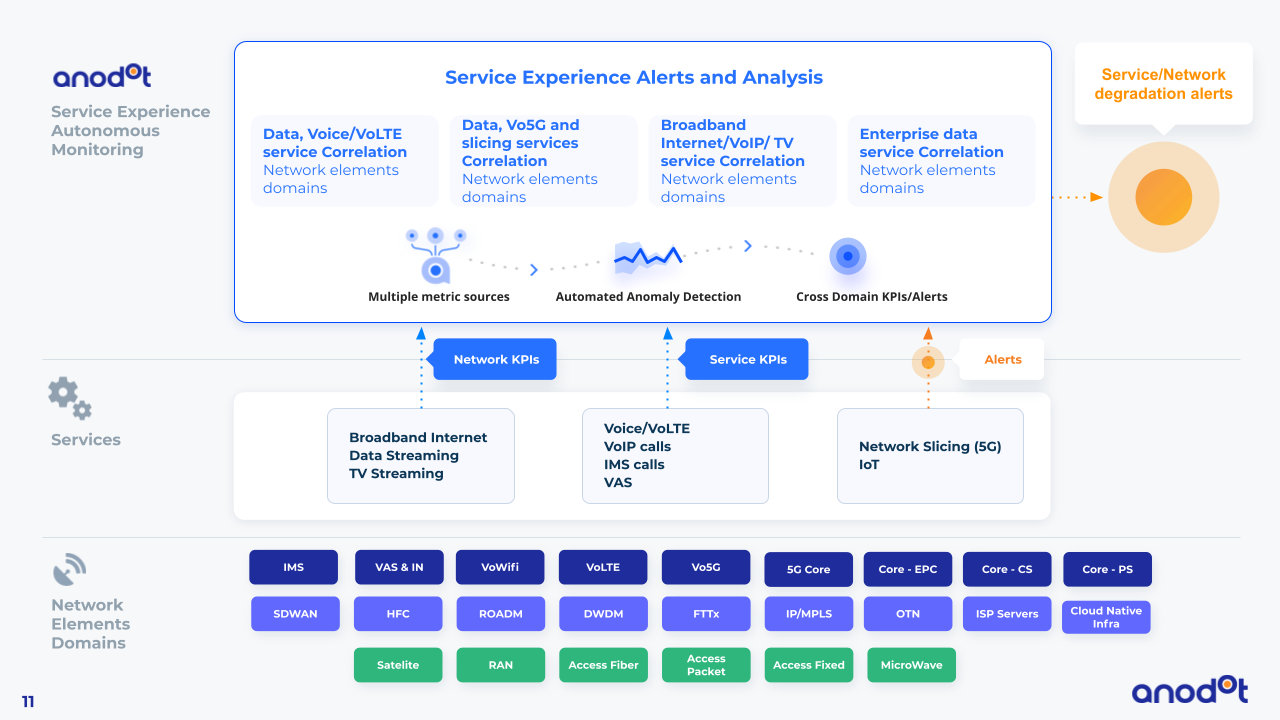
Service experience monitoring uses artificial intelligence to understand how customers experience the network and services, simplify customer experience management, and accelerate and automate problem resolution in complex multi-domain CSP environments. Service experience monitoring uses big data, analytics, and machine learning capabilities to collect and aggregate data generated by multiple network elements and domains, and autonomously analyzes the data to detect significant events and patterns related to service experience degradation and network availability issues for rapid remediation.
How CSPs use Anodot
Anodot’s autonomous network monitoring platform is the brain on top of the OSS, giving CSPs a holistic view across domains for real time detection of service-impacting incidents. Anodot collects and analyzes data across the entire telco stack: all data types from all network types, layers and domains — at scale. All metrics are actively monitored, enabling CSPs to achieve full visibility of service degradation incidents. Stakeholders receive Anodot’s alerts in real-time with the relevant anomaly and event correlation for the fastest root case detection and resolution.
Anodot is an off-the-shelf platform built for business users – the platform is ready to use with no data science required. It is seamlessly integrated with existing systems and any type of data source, and just as easily applied to new services (IoT, VoLTE, IPTV).
By enabling CSPs to monitor all network types (e.g., Mobile, Fix, TV and Transport) and network, Anodot empowers the fastest detection of impacted services and customer experience. This helps operation and NOC teams become proactive in their ability to identify service degradations and outages, improving network availability and customer experience.
Anodot enables CSPs to reduce the number of alerts by 90% and shorten their Time to Resolve by 30%. CSPs use Anodot to build resilience and service experience into their networks, prevent and mitigate outages and service degradation, save costs and drive operational efficiencies, providing better customer experience, and learning more about what is happening across their networks.


