
When organizations track metrics by the thousands, millions, or even billions, it’s helpful in many ways to understand which metrics have close relationships, meaning when one metric behaves in a certain way, one or more additional metrics can be expected to behave in a similar or opposite way.
In this article:
- What is Correlation Analysis?
- Why Correlation Analysis is Important
- The Benefits of Correlation Analysis
- Example Use Cases for Correlation Analysis
- How Anodot Uses Correlation of Metrics in Business Monitoring
- An Example of Correlation in Business Monitoring
What is Correlation Analysis?
Correlation analysis calculates the level of change in one variable due to the change in the other. If there is shown to be a strong correlation between two variables or metrics, and one of them is being observed acting in a particular way, then you can conclude that the other one is also being affected in a similar manner.
Finding relationships between disparate events and patterns can reveal a common thread, an underlying cause of occurrences that, on a surface level, may appear unrelated and unexplainable.
A high correlation points to a strong relationship between the two metrics, while a low correlation means that the metrics are weakly related. A positive correlation result means both metrics increase in relation to each other, while a negative correlation means that as one metric increases, the other decreases.
Why Correlation Analysis is Important
Correlation analysis can reveal meaningful relationships between different metrics or groups of metrics. Information about those connections can provide new insights and reveal interdependencies, even if the metrics come from different parts of the business.
If there is shown to be a strong correlation between two variables or metrics, and one of them is being observed acting in a particular way, then you can conclude that the other one is also being affected in a similar manner. This helps to group related metrics together to reduce the need for individual processing of data.
The Benefits of Correlation Analysis
Reduce Time to Detection
In anomaly detection, working with a vast number of metrics and surfacing correlated anomalous metrics helps draw relationships that not only reduce time to detection (TTD) but also supports shortened time to remediation (TTR). As data-driven decision-making has become the norm, early and robust detection of anomalies is critical in every industry domain, as delayed detection adversely impacts customer experience and revenue.
Reduce Alert Fatigue
Another important benefit of correlation analysis in anomaly detection is in reducing alert fatigue by filtering irrelevant anomalies (based on the correlation) and grouping correlated anomalies into a single alert. Alert storms and false positives are significant challenges faced by organizations today – getting hundreds, even thousands of separate alerts from multiple systems, when many of them stem from the same incident.
Reduce Costs
Correlation analysis helps significantly reduce the costs associated with the time spent investigating meaningless or duplicative alerts. In addition, the time saved can be spent on more strategic initiatives that add value to the organization.
Example Use Cases for Correlation Analysis
Marketing professionals use correlation analysis to evaluate the efficiency of a campaign by monitoring and testing customers’ reactions to different marketing tactics. In this way, they can better understand and serve their customers.
Financial planners assess the correlation of an individual stock to an index such as the S&P 500 to determine if adding the stock to an investment portfolio might increase systematic risk of the portfolio.
For data scientists and those tasked with monitoring data, correlation analysis is incredibly valuable when used for root cause analysis and reducing time to detection (TTD) and time to remediation (TTR). Two unusual events or anomalies happening at the same time/rate can help to pinpoint an underlying cause of a problem. The organization will incur a lower cost of experiencing a problem if it can be understood and fixed sooner rather than later.
Technical support teams can reduce the number of alerts they must respond to by filtering irrelevant anomalies and grouping correlated anomalies into a single alert. Tools such as Security Information and Event Management (SIEM) systems do this automatically to facilitate incident response.
How Anodot Uses Correlation of Metrics in Business Monitoring
Business monitoring is the process of collecting, analyzing, and using metrics and key performance indicators (KPIs) to track an organization’s progress toward reaching its business objectives and to guide management decisions. Anomaly detection is a key method for identifying when a business process is experiencing an unexpected change that may indicate an underlying issue is derailing the process.
As organizations become more data-driven, they find themselves unable to scale their analytics capabilities without the help of automation. When an organization has thousands of metrics (or more), analyzing individual metrics can obscure key insights.
A faster method is to use machine learning based correlation analysis in order to group related metrics together. In this way, when a metric becomes anomalous, all the related events and metrics that are also anomalous are grouped together in a single incident. This helps to reduce data processing time, reveal the root cause of an incident, and tie events together to reduce alert fatigue. On average, customers using Anodot have found correlation analysis helps reduce alert noise by up to 99%.
An Example of Correlation in Business Monitoring
Consider the applicability of correlation analysis in the realm of eCommerce promotions. For many retailers, the last quarter of the year accounts for more than 50 percent of their annual sales. Most merchants run various promotions to boost sales that correspond with Black Friday, Cyber Monday, and other holiday-related events.
Multiple factors are at play with any promotion, including the promotion type, promotional pricing, audience targeting, purchase intent, timeliness, media used for the promotion, and numerous other factors.
Correlation analysis finds a natural fit to determine which factor(s) play a key role in driving the top and bottom lines in the sales. The ability to identify strong correlations would help marketers double down on the corresponding promotions.
To illustrate, consider the figure below, which shows how two correlated anomalies – a spike in page views (top chart) and add to carts (bottom chart) – for an eCommerce site points to an anomalous sales pattern. The shaded area (the baseline) is the normal pattern of sales for a promotional event of this nature.
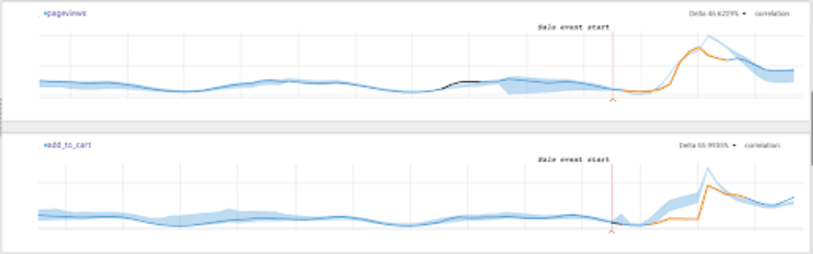
Clearly, the add to cart metric is underperforming. Correlating the relevant event (the sale) and the related metrics (pageviews and add to cart) together, it underscores the irregularity of a drop in both those metrics.
When the event started, the team was alerted about the fact that the sales event did not yield the expected increase in both the correlated metrics; in fact, page views actually dropped(!) 46 percent compared to the expected spike, leading to a drop of 66 percent in add to cart. These drops were identified because the effect of the sales event (an “external” variable to the metric), was correlated to the values of the metric. If the correlation between the metrics and the event was not taken into account, the drop would have seemed like an increase.
Discovering the relationships among data metrics has many practical applications in business monitoring. Correlation analysis can help identify the root cause of a problem and vastly reduce the time to remediate the issue. It also helps to group events together in order to reduce the number of alerts generated by the events, in turn reducing alert fatigue among support personnel and the cost of investigating duplicative alerts.