What is anomaly detection?
Anomaly detection (aka outlier analysis) is a step in data mining that identifies data points, events, and/or observations that deviate from a dataset’s normal behavior. Anomalous data can indicate critical incidents, such as a technical glitch, or potential opportunities, for instance, a change in consumer behavior. Machine learning is progressively being used to automate anomaly detection.
What is an anomaly?
With all the analytics programs and various management software available, it’s now easier than ever for companies to effectively measure every single aspect of business activity. This includes the operational performance of applications and infrastructure components as well as key performance indicators (KPIs) that evaluate the success of the organization. With millions of metrics that can be measured, companies tend to end up with quite an impressive dataset to explore the performance of their business.
Within this dataset are data patterns that represent business as usual. An unexpected change within these data patterns, or an event that does not conform to the expected data pattern, is considered an anomaly. In other words, an anomaly is a deviation from business as usual.
But then what do we mean by “business as usual” when it comes to business metrics? Surely we don’t mean “unchanging” or “constant;” there’s nothing unusual about an eCommerce website collecting a large amount of revenue in a single day – certainly if that day is Cyber Monday. That’s not unusual because a high volume of sales on Cyber Monday is a well-established peak in the natural business cycle of any business with a web storefront.
Indeed, it would be an anomaly if such a company didn’t have high sales volume on Cyber Monday, especially if Cyber Monday sales volumes for previous years were very high. The absence of change can be an anomaly if it breaks a pattern that is normal for the data from that particular metric. Anomalies aren’t categorically good or bad, they’re just deviations from the expected value for a metric at a given point in time.
Table of Contents
What is time series data anomaly detection?
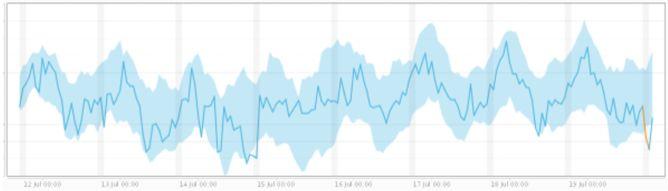
Successful anomaly detection hinges on an ability to accurately analyze time series data in real-time. Time series data is composed of a sequence of values over time. That means each point is typically a pair of two items — a timestamp for when the metric was measured, and the value associated with that metric at that time.
Time series data isn’t a projection in and of itself. Rather, it’s a record that contains the information necessary for making educated guesses about what can be reasonably expected in the future. Anomaly detection systems use those expectations to identify actionable signals within your data, uncovering outliers in key KPIs to alert you to key events in your organization.
Depending on your business model and use case, time series data anomaly detection can be used for valuable metrics such as:
- Web page views
- Daily active users
- Mobile app installs
- Cost per lead
- Cost per click
- Customer acquisition costs
- Bounce rate
- Churn rate
- Revenue per click
- Volume of transactions
- Average order value
- And more
Time series anomaly detection must first create a baseline for normal behavior in primary KPIs. With that baseline understood, time series data anomaly detection systems can track seasonality — the cyclical patterns of behavior within key datasets. A manual approach may help identify seasonal data in one data plot. But when you have to scale to thousands or millions of metrics, tracking time series data and spotting anomalies has to be automated to deliver valuable business insights.
The three different types of time series anomalies
Understanding the types of outliers that an anomaly detection system can identify is essential to getting the most value from generated insights. Without knowing what you’re up against, you risk making the wrong decisions once your anomaly detection system alerts you to an issue or opportunity.
Generally speaking, anomalies in your business data fall into three main outlier categories — global outliers, contextual outliers, and collective outliers.
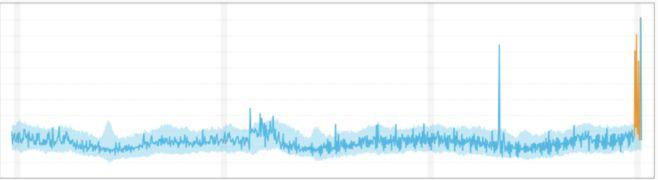
1. Global outliers
Also known as point anomalies, these outliers exist far outside the entirety of a data set.
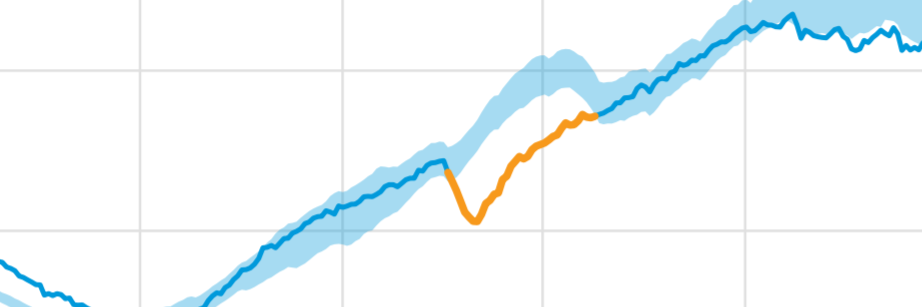
2. Contextual outliers
Also called conditional outliers, these anomalies have values that significantly deviate from the other data points that exist in the same context. An anomaly in the context of one dataset may not be an anomaly in another. These outliers are common in time series data because those datasets are records of specific quantities in a given period. The value exists within global expectations but may appear anomalous within certain seasonal data patterns.
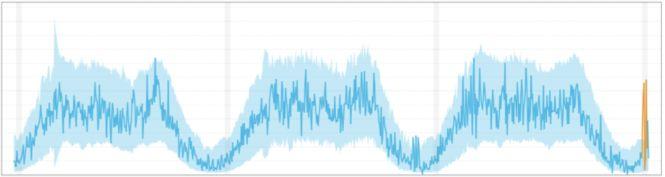
3. Collective outliers
When a subset of data points within a set is anomalous to the entire dataset, those values are called collective outliers. In this category, individual values aren’t anomalous globally or contextually. You start to see these types of outliers when examining distinct time series together. Individual behavior may not deviate from the normal range in a specific time series dataset. But when combined with another time series dataset, more significant anomalies become clear.
Why your company needs anomaly detection
With all the analytics programs and various management software available, it’s easier than ever for you to effectively measure every single aspect of business activity. That includes the operational performance of applications and infrastructure components as well as key performance indicators (KPIs) that evaluate the success of your business.
With millions of metrics to measure, you end up with a massive and ever-increasing dataset to explore. But what happens when there are unexpected changes in data patterns? These anomalies—deviations from business as usual — are caused by business incidents in the real world. Whether it’s a new successful marketing campaign that increased leads, a promotional discount that drove up sales, a price glitch that’s impacting revenue, or anything in between, you need to be able to trace the root cause.
Because there are millions of metrics to track across your business, there are also millions of unique ways to gain insights from anomaly detection. But a closer look shows that there are three main business use cases for anomaly detection — application performance, product quality, and user experience.
1. Anomaly detection for application performance
Application performance can make or break workforce productivity and revenue. Traditional, reactive approaches to application performance monitoring only allow you to react to issues, leaving your business to suffer consequences before you even know there’s a problem.
With over 100 million monthly active users worldwide, Waze decided it needed anomaly detection to identify and resolve potential application performance issues before they affected users. Machine learning algorithms help its anomaly detection solution seamlessly correlate data with relevant application performance metrics to provide a complete story for business incidents that the IT team can take action on.
But it’s not just software and app companies like Waze that benefit from anomaly detection for application performance. The following industries can also take advantage:
- Telco: As some of the largest time series data producers in the world, telco operators need advanced solutions to mitigate anomalies that could cause system-wide degradation in their complex networks. For Optus Networks, manually tracking metrics with traditional BI tools wasn’t enough. Monitoring things like jitter, latency, and call quality, and more across its networks requires anomaly detection that allows the telco to proactively address performance in real-time.
- Adtech: Processing trillions of transactions on a monthly basis with real-time auctions that occur within 40 milliseconds leaves little room for manual KPI monitoring. While operations teams can stay on top of technical data center issues, more complex application performance trends are less clear. Rubicon Project, one of the world’s largest ad exchanges, uses anomaly detection to monitor all transactions in real-time and maintain the health of its ad marketplace.
2. Anomaly detection for product quality
For product managers, it’s not enough to trust every other department to take care of necessary monitoring and alerts. From initial rollout to each instance that you introduce a new feature, you need to be able to trust that the product will work smoothly.
Because your product is always evolving, every version release, A/B test, new feature, purchase funnel tweak, or change to customer support can result in behavioral anomalies. When you don’t properly monitor for these product anomalies, ongoing issues will cost your company millions in lost revenue and damaged brand reputation.
Any product-based business can benefit from anomaly detection and the following are two key examples of how:
- eCommerce: While developers can cover the technical aspects of monitoring an eCommerce platform, someone has to monitor the business funnel, conversion rates, and other key KPIs. This role falls on the product manager. But when you’re trusting static thresholds to monitor dynamic funnel ratios, you’ll miss out on key alerts in the context of seasonality and other time series elements. Or, you’ll fail to identify pricing glitches like Argos did. Improper product pricing led to a site crash, many angry customers, and plenty of lost revenue. With anomaly detection, product quality issues like price glitches are detected much faster—before a site crashes and customers are impacted.
- Fintech: Security is important for any digital business, but it’s even more critical for fintech. Customers and financial partners need assurance that transactions are processed securely — and it’s your job to stay ahead of advanced attacks. With anomaly detection in place, data sources are integrated into a centralized platform, giving you total visibility into performance and operations and the ability to uncover key security vulnerabilities.
3. Anomaly detection for user experience
When you have a faulty version release, experience a DDoS attack, or have a customer support process change that backfires, you risk having usage lapses across customer experiences. Reacting to these lapses before they impact user experience is crucial to avoiding frustrations that lead to churn and lost revenue.
Proactively streamlining and improving user experiences will help improve customer satisfaction in a variety of industries, including:
- Gaming: Monitoring the permutational complexities of gaming experiences can’t be done with manual thresholds. Anomaly detection solutions monitor operating systems, levels, user segments, different devices, and more with artificial intelligence (AI) to ensure glitches and errors that would hurt user experience can be remediated quickly. Outfit7 takes advantage of anomaly detection because it helps them anticipate and address challenges as their games continually evolve.
- Online Business: Smooth operation is essential for any online business. To ensure UX is never compromised, IT must mitigate API errors, load-time glitches, server downtime, and more — all in real-time. Anomaly detection ensures complete coverage and minimal response time across all platforms, operating systems, and data centers. For Wix, anomaly detection means rapid root cause analysis of all potential issues through a single, unified platform.
4. Anomaly detection for cloud cost management
The ability to detect anomalies in cloud costs helps engineers and finance teams identify and analyze the root cause of significant changes in spend so they can take proactive action. A platform that can do this must be able to track cloud expenditure at a granular level and identify anomalies in real time. Continuous cost monitoring and anomaly detection is especially important in the dynamic environment of cloud computing.
Anomaly detection for cloud cost management works by analyzing historical data for a specific metric and identifies patterns and trends in order to build models of predictable outcomes. Machine learning algorithms can then detect activity that doesn’t align with anticipated cloud expenditures or deviates from the established pattern.
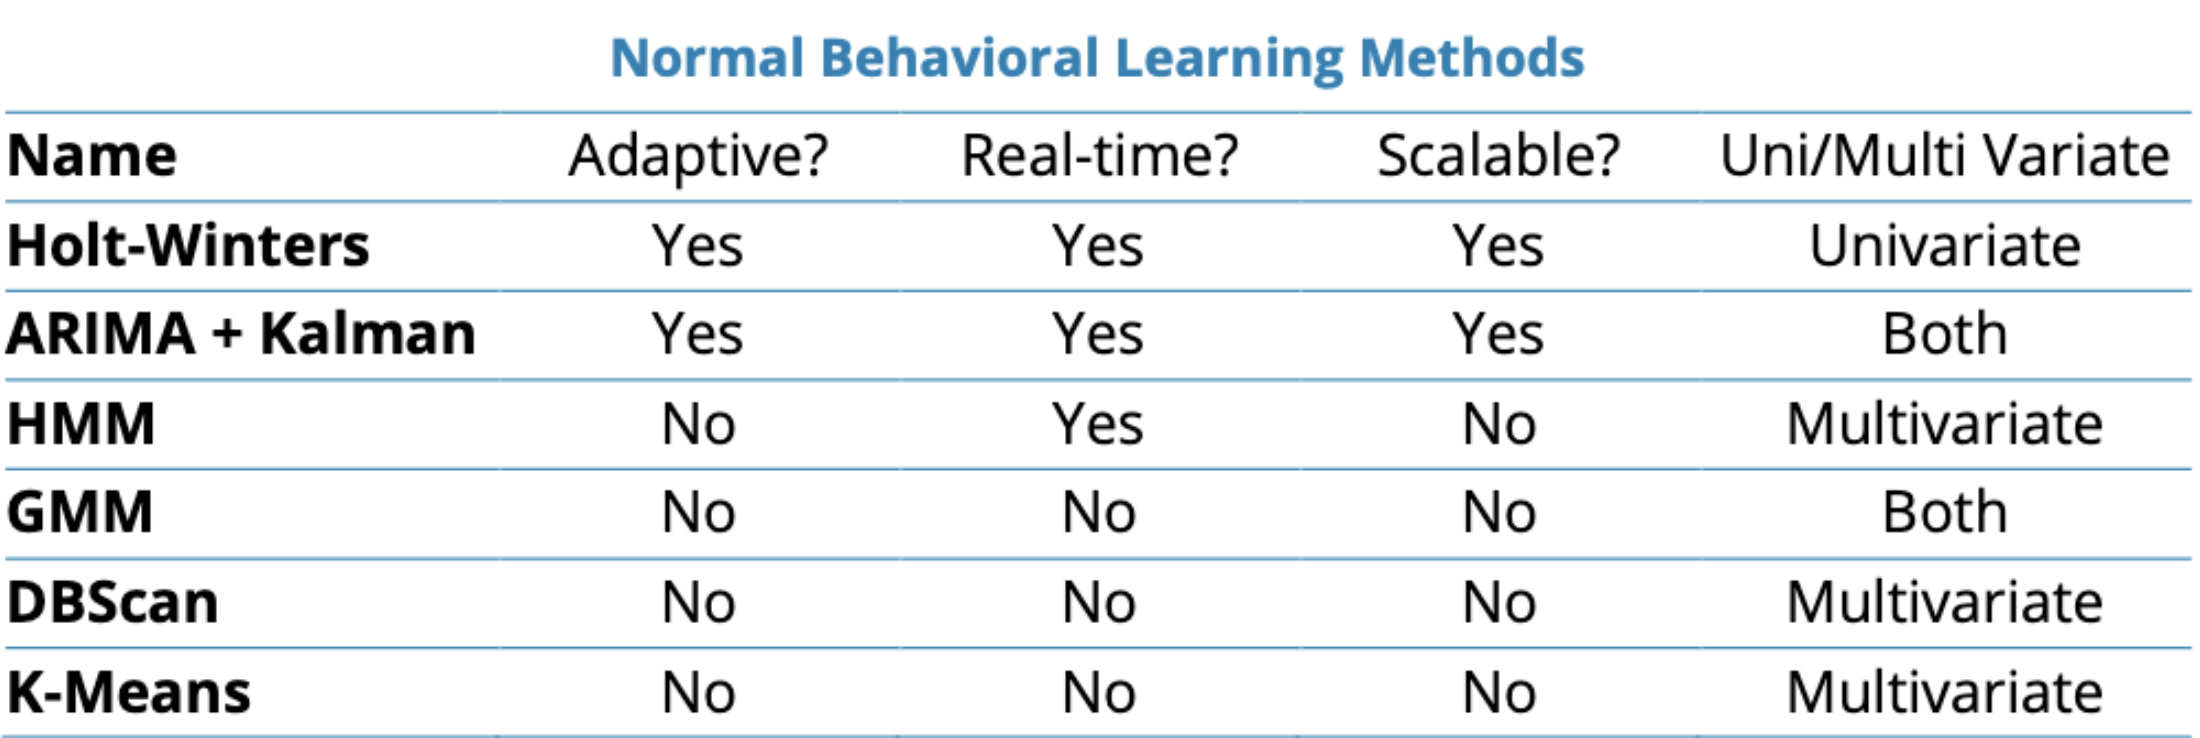
Understanding different anomaly detection methods
In the past, manual anomaly detection was a viable option. You only had a handful of metrics to track across your business and the datasets were manageable enough for an analytics team. But you have more data than ever at your fingertips and there’s one glaring problem with traditional, manual anomaly detection — it doesn’t scale. Without hundreds, thousands, or even millions of metrics to manage, the cost and complexity of manual anomaly detection is impossible to bear.
There’s a limit to the personnel you can hire, expertise they bring to the table, and accuracy of insights they can deliver in anomaly detection. First, consider the sheer amount of people it would take to successfully perform manual, real-time anomaly detection. Each person might be able to perform real-time anomaly detection for 100 metrics at once. For 1,000 metrics, you’d 10 people on staff full-time for continuous monitoring. When you get up to 1 million metrics or more, you’re looking at a staff of 10,000+ people just for anomaly detection. That’s just not feasible. And that’s not even mentioning the inconsistencies and human error that would come with manual analytics.
Meeting the demands of modern businesses requires automated anomaly detection that can provide accurate, real-time insights regardless of how many metrics you need to track. Truly automated anomaly detection systems should include detection, ranking, and grouping of data, eliminating the need for large teams of analysts.
The key to automating anomaly detection is finding the right combination of supervised and unsupervised machine learning. You want the vast majority of data classifications to be done in an unsupervised manner (without human interaction). However, you should still have the option to have analysts feed algorithms with datasets that will be valuable to creating baselines of business-as-usual behavior. A hybrid approach ensures that you can scale anomaly detection with the flexibility to make manual rules regarding specific anomalies.
Related guide on cloud cost optimization
Design principles of anomaly detection
There are five main considerations when building an anomaly detection system:
Timeliness – How quickly does the company need an answer to determine if something is an anomaly or not? Does the determination need to be in real time, or is it okay for the system to determine it was an anomaly after a day, week or month?
Scale – Does the system need to process hundreds of metrics, or millions? Will the datasets be on a large scale or relatively small scale?
Rate of change – Does the data tend to change rapidly, or is the system being measured relatively static?
Conciseness – If there are a lot of different metrics being measured, must the system produce an answer that tells the whole picture, or does it suffice to detect anomalies at each metric level by itself?
Definition of incidents – Are the expected incidents well defined? Is anything known about them in advance in terms of what types of things can be anomalous in the data? Can incidents be categorized over time?
Build vs. Buy: anomaly detection deployment
When you’ve made the decision to invest in anomaly detection for your business, the next step is determining how to get the greatest return on that investment. And that means making a decision regarding the build vs. buy dilemma. While there may not be a right or wrong answer in the general sense, your specific needs will determine which path is best for your business.
To make the right choice between building and buying anomaly detection, consider key factors such as:
- The size of your company and the volume of data that must be processed
- Your budget for implementing this new system
- Expected time to value in terms of immediate need for anomaly detection and the demands of business stakeholders
- Capacity for development and maintenance within your IT team
- Expansion plans for your business and how that will impact data analytics
When you partner vendors like Anodot for anomaly detection, you can achieve time to value in 30 days as opposed to months or years. Anodot is intuitive enough for business users and sends actionable, automated alerts whenever an anomaly is detected.
With advanced off-the-shelf capabilities, you can cut annual costs by 40%-90% depending on your specific use cases.
Whichever path you choose, make sure you’re prepared to capture, analyze, and package data in ways that will deliver meaningful, actionable insights to business users — it could be the difference between business-as-usual and ongoing glitches that cost you millions.
Conclusion
This overview should give you a good idea of what anomaly detection is, why it’s necessary for your business, and how these systems work on a high level. Businesses have been laser-focused on optimizing data collection — and now it’s time to use that data to gain insights that will drive your business forward.
Continue on to the second post in this series, where we discuss why it’s critical for your business to detect anomalies in real-time.
—
And if you’re ready to get more out of anomaly detection and take advantage of an advanced, automated solution, contact us for a free demo.
Related Guides:
- Top 13 Cloud Cost Optimization: Best Practices for 2025
- Understanding FinOps: Principles, Tools, and Measuring Success
Related Products:
Written by Ira Cohen
Ready to see our solution in action?
Prepare to see how Anodot leverages AI to constantly monitor and correlate business performance, identify revenue-critical issues, and provide real-time alerts and forecasts.