Resources

FILTERS

Resources

business analytics in 2020
Documents 1 min read

The Modern Analytics Stack

A brief overview of the components of today's AI-driven analytics stack, and how they compare to their traditional counterparts. This white paper also surveys the leading solutions for each component.
Blog Post 5 min read

5 Fatal Flaws of CEO Dashboards that Derail Leadership and Decision-Making

The claim for most CEO dashboards is that they provide  a complete view of enterprise performance and reliable, real-time information. Yet, if you’ve ever taken the time to read about building the perfect CEO dashboard, you might remember time-consuming tips and tricks explaining which metrics to include in the data monitored by the dashboard, and how that data should be presented. This first step - the selection of which metrics to include - is the fatal flaw of CEO dashboards, because it’s the first opportunity for those who rely on them to miss  critical information. Fatal Flaw #1 CEO dashboards lack intelligent correlation Looking for new business insights and intelligence, and choosing which metrics to include is more art than science.  No one knows the answers to questions that haven’t been asked yet. An important actionable insight can be present in any metric, and why they should all be monitored. More importantly, insights are often only found through correlation of various metrics. One of the keys to making data actionable in any organization is being able to see the whole picture. CEO dashboards often fail to provide all of the necessary information you need to make informed decisions.  These missing links of data can delay a decision, or lead to misinformed decisions, which can be detrimental to your organization. Even if all necessary information is being gathered, it can’t present a coherent picture.  With CEO dashboards, you’re forced to guess what’s important enough to be given the limited real estate on the dashboard. Correlating and acting on this data takes time and manpower, and for larger organizations with a lot of business activity this can add up significant amounts of time before actionable data is consolidated and, if possible, rendered usable. Fatal Flaw #2 Only shows how actual performance meets business goals, but not why CEO dashboards can only indicate how well your company’s actual performance meets your business goals, but can’t show why. If you are lucky enough to benefit from a string of beneficial business events outside your control (social media buzz causes a spike in orders, a competitor suffers a brand-damaging PR mistake, etc.), you won’t ever know that, and more importantly, might get caught unable to respond when that spike hits. Without granular real-time metrics, you won’t connect the cause to the jump in orders. Actionable insight of what caused the spike in orders would allow you to organize enough inventory to respond to the demand, and try to further leverage the buzz for more growth. Fatal Flaw #3 Wasting time driving down the wrong road A CEO dashboard, however, won’t indicate social media buzz until all the hype has died down, if it shows at all. Harvard Business Review  explained that “…dashboards are poor at providing the nuance and context that effective data-driven decision making demands.”  When the bump is over and the top-level KPIs settle back down to normal, you may be identifying a problem to explain the decrease, instead of searching for to leverage the increase – now a lost opportunity. This results in lots of wasted time looking for the wrong root cause, clouding decision-making and leaving your company vulnerable to a competitor’s agile maneuvering. There’s a real cost to relying on dashboards to untangle the correct causation behind a discovered incident. It can even lead to mistaken conclusions, like how a GPS upgrade increased car accidents when it actually significantly decreased them. Fatal Flaw #4 CEO Dashboards don’t provide intelligent prioritization Collecting thousands of events or alerts every minute from your applications and infrastructure, and presenting that data in a dashboard isn’t analytics. The dashboard may look sexy and have beautiful widgets. Users apply filters on this data, performing their own analysis and work. Deriving intelligence from data shouldn’t require an end user to define what to look for, or where, or what are the most critical KPIs, or what normal or abnormal is. This is not intelligence because a user is telling the dashboard exactly what data to show. Fatal Flaw #5 Relevance - interpreting a dashboard a thousand ways CEO Dashboards fail to properly incorporate all of the relevant data sources necessary to make a truly informed, real-time decision, and critical information may not be displayed quickly or effectively enough to act upon.  A single data signal can be both a strong insight for one person and just more noise for another. There’s a level of subjectivity when it comes to the relevance of data. In order to be relevant, data needs to be delivered with the right context, correlation and association. If data isn’t packaged well for decision makers then it will not be acted on. If insights are trapped in a dashboard tool that managers are too overwhelmed to access or the data is delivered too infrequently to use, then the insights may never be found. In business, leaving data up to interpretation can be risky and costly. CEO dashboards belong in the rear-view mirror Business strategy is only effective if you possess the appropriate intelligence and agility to outmaneuver your competition. Dashboards aren’t going to provide insight fast enough when hundreds of thousands of dollars are lost per hour due to a pricing glitch on an ecommerce site, no matter what color scheme, chart type or font is used. Businesses need real time insights This is why CEOs should abandon these dashboards, and turn to an AI analytics platforms to find all the opportunities in your data.
Documents 1 min read

Part I: The Essential Guide to Time Series Forecasting - The Value

Learn the key components and processes of automated forecasting, as well as business use cases, in this 3-part series on time series forecasting.
Blog Post 4 min read

South Park Exposes Vulnerability of IoT Streaming Data by Activating Alexa Devices Across America

South Park Kids Make Jokes and IoT Devices Seriously React In the debut episode for South Park’s 21st season, the beloved characters not only poked fun at the white nationalist movement in an episode called 'White People Renovating Houses', but also yelled commands at their own cartoon Alexa devices throughout the episode. This actually started activating Alexa and Google Home models in the homes of viewers. In the episode, after proclaiming that smart devices are stupid, South Park character Eric Cartman got a smartphone and an Amazon Echo speaker. Cartman’s interaction with Alexa starts innocently enough, with a request to Alexa to set an alarm and tell a joke. The best moments definitely came as the South Park kids asked Amazon Echo’s Alexa to do and say increasingly disgusting things. “It’s a very dumb joke that never gets old because who hasn’t asked their smart home device something idiotic?” This has been seen before. Earlier this year, in Burger King’s “Whopper Burger” television ad, they  activated Google Home devices and had them recite the Wikipedia entry related to Burger King’s Whopper. “The reaction at the time ranged from laughter to outrage. In the end, Burger King and its ad agency won a top industry award, a Cannes Lions for the stunt.” Stirring Up Trouble with IoT Devices Leads to Serious Reactions on Twitter Not only was it revealed that there are people who own both an Alexa and a Google Home, but more seriously that the show could stir up trouble for both. As viewers got further into the episode, some viewers even had to unplug the listening mechanism on their devices. Viewers took to Twitter to share videos and comment on what the episode was doing to their own devices. This episode of South Park drove my Alexa crazy. I never knew my Alexa had such a potty mouth. pic.twitter.com/lWIHySClRd — Tony French (@TonyLFrench) September 14, 2017 New South Park episode is making Alexa go nuts. pic.twitter.com/Rs8oNL7s2u — Tom Buros (@TomBuros) September 14, 2017   Breaking Boundaries Exposes an IoT Weakness Not only was this intrusion a massive violation of entertainment’s fourth wall,  but there is a much greater issue here with the appearance of a new form of ‘digital voice attack’, further weakening our boundaries. “The fact that Alexa doesn’t identify users means that for “her,” all us humans are the same. Actually, you don’t even need a real person to speak.” The world of Internet of Things (IoT) introduces new types problems. While we have felt a general sense of security and control, this act and the targeted technology forces us to redefine our boundaries - borders that are much harder to define and measure because they are not definite. Detecting When Something Goes Wrong with Anodot AI Analytics Anodot actually already warned about the potential for this happening back in February. This raises the underlying question: How do we detect and recognize when these now ubiquitous AI-controlled systems get something wrong? Most AI systems aren’t quite capable of dealing with these difficult, anomalous behaviors. More importantly, this situation could have been avoided, but should serve as a warning to companies making real-time business decisions based on streaming data—there needs to be systems in place to detect when something out of place happens, and to let the right people know. Anodot would have flagged the dramatic spike in search terms and alerted the responsible Amazon team to the issue to investigate further.  Anodot would have been crunching Amazon’s time series data to determine the normal range for these searches. When the spike in Alexa-powered shopping lists rose beyond normal limits, Anodot would have triggered an action and applied a significance score that could help Amazon determine how fast and comprehensive the response might have been.  
Andot Hosts AI Talk At CDAO Exchange 2019
Documents 1 min read

WHITE PAPER: Detecting the Business Incidents that Matter with Anomaly Detection

Kickstart your business monitoring - see how machine learning anomaly detection can provide your team with the kind of spot-on, real-time alerts that prevent costly incidents and protect revenue.
Blog Post 5 min read

In the Automation Age: Use AI Analytics to Escape ‘Business KPI Dashboard Hell’

Business KPI dashboards don’t provide actionable insights now Business data analysts are in dashboard hell right now. They have to interpret data from so many different sources and then try to figure out what is the best action to take, with the most important decisions being made based on this information.  Despite having “Key Performance Indicators (KPI) Dashboards” for business, they struggle to get an integrated view of all business metrics. With greater volumes of data being collected, data analysts can’t keep up with the pace. Companies are making tremendous investments in dashboard and reporting technologies, like Business KPI dashboards, to keep better tabs on their operations. You’ve probably seen business dashboards with multiple KPIs that show sales figures, customer satisfaction score, churn etc. While designed to provide high level visibility of different business metrics, nevertheless data analysts simply can’t keep up with the demand to crunch all the data and then extract answers from their business KPI dashboards. Business KPI dashboards provide too much information and too little insight There are many reasons why business KPI dashboards can’t be relied on to provide you with actionable insights in real time. While an analyst can analyze data based on one or two dimensions (for example, device and geo), when an issue happens, they then have to manually add more KPI dimensions, spending a lot of time to find the source of an issue. Standard business KPI dashboards fall short when it comes to usability, specifically the accessibility of the important signals in the data.  Unable to automatically highlight what’s important, dashboards require analysts to process the data manually and iteratively, and still lack the ability to instantly drill down into granular metric-level data.  Traditional analytics and BI solutions, like business KPI dashboards, deal with historical data, not this minute, not showing a real-time status. Due to their limitations, business KPI dashboards typically look at only a subset of all the available data. These limitations yield at best delayed and at worst incomplete results. Business KPI dashboards simply cannot provide intelligent correlation The usual business KPI dashboards can’t understand a KPI in the context of the many, complicated, direct and indirect relationships between all your metrics. Data complexity, data-type growth, and data volumes threaten to overwhelm the interface, weakening the dashboard’s consumability.  Locating information takes profound familiarity of each dashboard metric, adequately see events and an elephant’s memory as you to try to visually correlate the data from across the organization, trying to figure out what to do next. When a BI team has trouble keeping up, they often get unpleasant surprises, discovering issues and opportunities long after the financial or reputation damage is done. Despite configuring multiple business KPI dashboards, they can still face many data blind spots. With data constantly changing, looking for answers on business KPI dashboards is a struggle, as something else could come in from left field, totally off the radar, affecting the results. 
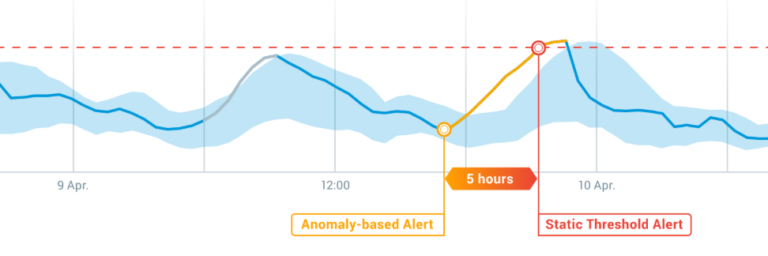
AI analytics identifies trends and provides correlations in real-time Instead of long investigations and analysis through multiple business KPI dashboards and making manual correlations, business analysts can rely on AI analytics to probe deeper into the data and correlate simultaneous anomalies, revealing critical insights into operations. A real-time, large-scale automated anomaly detection system using machine learning methods can free data analysts from constant manual monitoring around just a few KPIs. When working with thousands or millions of metrics, you can’t just hire a staff of thousands of analysts to analyze your data for key decisions. Using automated significance ranking of detected anomalies, data analysts can focus in on the most important business incidents. This level of automation can provide actionable insights in real-time. Insights built upon deep learning, especially in complex, fast moving digital industries like ad tech, add another level of protection to company revenue. Both Microsoft and Google rely on advances in deep learning to increase their revenue from serving ads. Advanced machine-learning analytics allow ad tech companies to identify trends and correlations in real time, like instantly correlating a drop in a customer’s bidding activity to server latency. An automated AI analytics solution maps out the relationships between all your metrics, even if they number in the millions. Turning on all of the lights in the room, instead of using just a flashlight, allows companies to correlate all relevant data, not just the typical collected information presented in business KPI dashboards. By taking in the full picture, you can make better decisions to impact business success and improve customer satisfaction. And that’s where AI analytics really shines. Unlike traditional BI tools, by detecting the business incidents that matter and identifying why they happen, AI analytics lets you remedy urgent problems faster and capture opportunities sooner. Our automated AI analytics solution uses the latest breakthroughs from machine learning and data science to give our customers actionable insights in real time, something they were not able to achieve from their dashboard based business intelligence, bringing valuable business opportunities and insights to the surface.  
Blog Post 4 min read

eToro Gets Rapid Insights from Growing Amounts of Data Using Anodot’s AI Analytics

How does eToro stay on top with so much changing and vital data to be aware of? We visited their headquarters and met with Elad Gotfrid, eToro’s Director of IT, who shared their approach for handling the company’s data.
Documents 1 min read

WHITE PAPER: How Three eCommerce & Retail companies are Harnessing AI to Gain Revenue

Learn how leading eCommerce and retailers are leveraging the power of machine learning - identifying problems and leveraging business opportunities faster.
Documents 1 min read

Case Study: Amid Pandemic, Booking Website Uses Autonomous Business Monitoring to Optimize Spending

GetYourGuide's engineering team leverages anomaly detection across the business, from monitoring revenue to watching for brand hijacking and affiliate fraud. Anodot alerts bring attention to the underlying issues much more quickly than any other method, which is helping prevent financial loss and keeping their global business running smoothly.