By @InterpretableAI & @IraIraCohen
Finding relationships between disparate events and patterns can reveal a common thread, an underlying cause of occurrences that, on a surface level, may appear unrelated and unexplainable.
The process of discovering the relationships among data metrics is known as correlation analysis. For data scientists and those tasked with monitoring data, correlation analysis is incredibly valuable when used for root cause analysis and reducing time to remediation. The longer it takes to understand and fix the root cause, the greater the cost to the organization. The applications are multitudinous, however in this series we focus on the business realm.
Earlier in this series on correlation analysis, we evaluated applications in a variety of business use cases, specifically in the context of promotional marketing and telco. In a similar vein, we’ll explore here technical considerations to better utilize correlation analysis in fintech analytics, specifically in the algorithmic trading space.
______________________________
The algorithmic trading market is expected to register a CAGR of 11.23 percent in the forecast period from 2020 to 2025. The global market for algorithmic trading is projected to be around $19.2 billion by 2027, growing at a CAGR of 8.7 percent over the period 2020-2027. Exchanges that correspond to the bulk of the trading volume include, but are not limited to CME Group, CBOE, NASDAQ and NYSE (CFTC serves as the regulator).
The following throws light on the key categories and trading instruments that underlie algorithmic trading.
- Currency (a daily turnover of over $6 trillion), Cryptocurrency, Interest Rate (average daily volume for Nov 2020 was 8.8 million contracts on CME): the most common investment products to this end are the following:
- Options
- Swaptions
- Futures, Futures Options (e.g., click here for products based on these Bitcoin)
- Commodities, Energy (average daily volume for Nov 2020 was 2.1 million contracts on CME): the most common investment products to this end are the following:
Options
Futures, Futures Options - Equities (a daily turn over of more than $2 billion on NYSE and $1B on NASDAQ)
- Options (a daily turn over of more than $10 billion on both NASDAQ and CBOE)
One of the key aspects of algorithmic trading is early detection of arbitrage opportunities. This may manifest in a variety of flavors – one of particular interest is volatility arbitrage, a situation when there is a difference between implied volatility and realized volatility of an option (more here for an overview of different types of arbitrage). Exploiting such arbitrage opportunities critically rests upon, besides other things, data fidelity, which in turn can be assessed via correlation analysis as discussed later in the article.
2020 has been a tumultuous year on multiple fronts. The following plot overlays S&P 500 and VIX for the year. We note from the plot that at the onset of the pandemic, the index fell materially and since then has gradually recovered and, in fact, has surpassed the previous highs. Although both S&P 500 and VIX cannot be traded directly, the anti-correlated trend provides an insight on how to structure trades using, say, ETFs based on these indices.
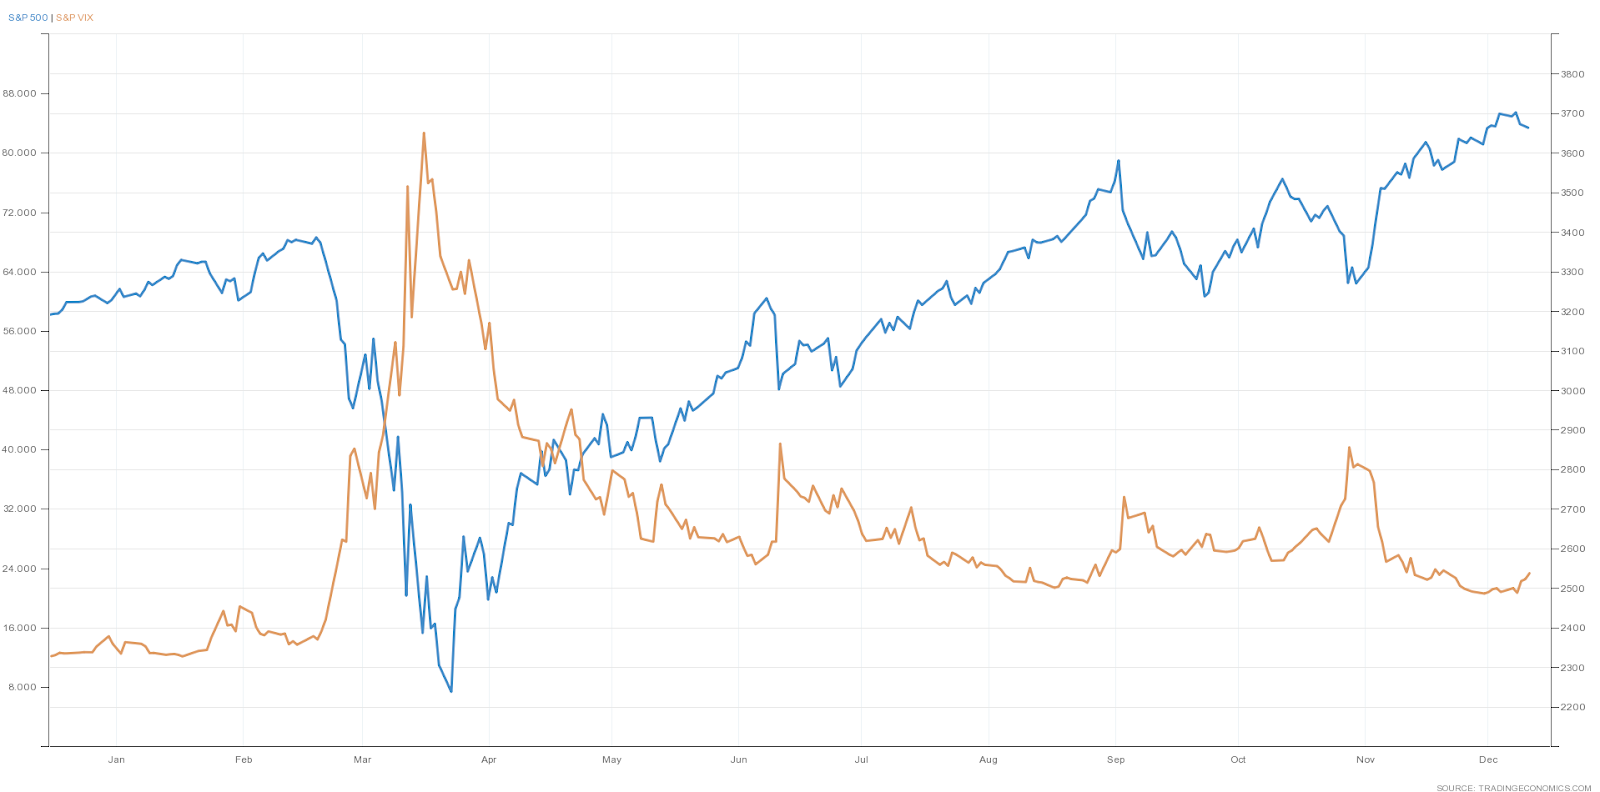
Source: Trading Economics
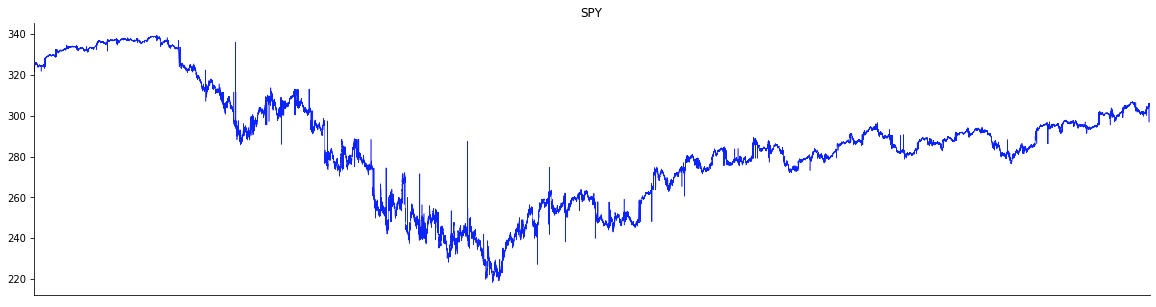
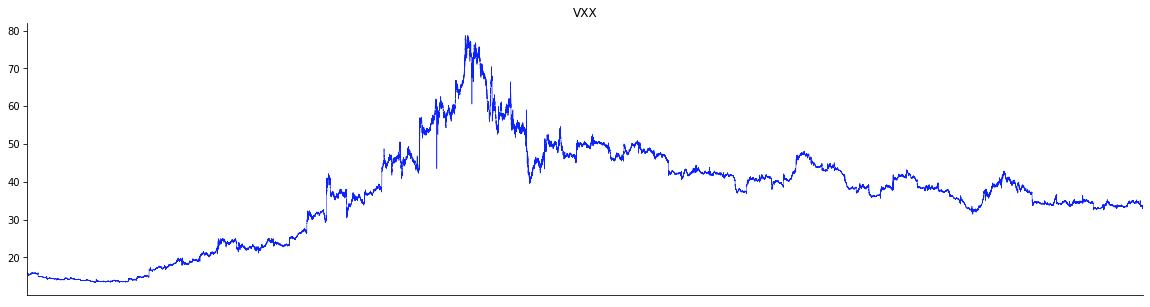
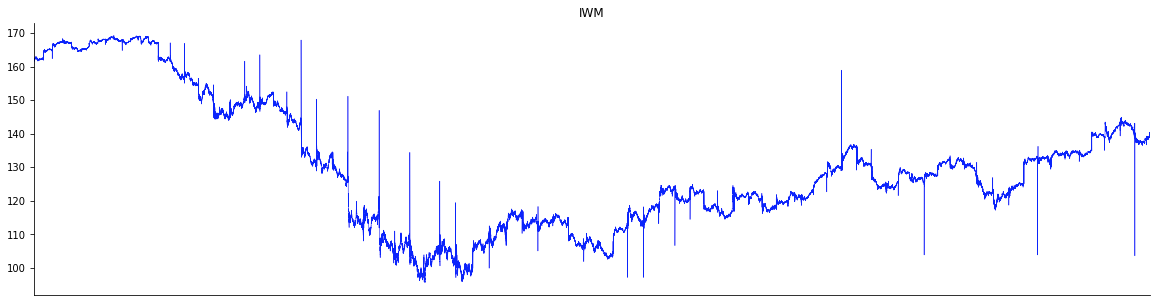
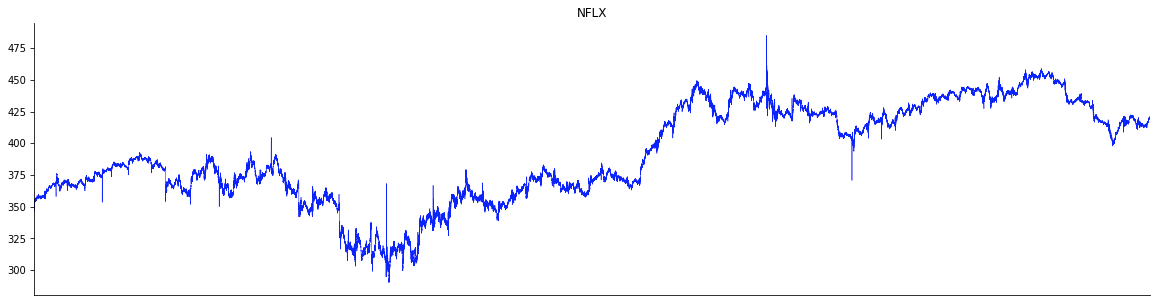
The plots below show the time series – at the second granularity – of VXX, IWM and NFLX for the period Feb. 3 through May 29, 2020, during which the market corrected and rebounded. Note that on a daily basis, the key indices such as DJI and S&P 500 had corrected by more than a whopping 10 percent. From the plots below we note that, not unexpectedly, VXX is anti-correlated to the rest. However, the spikiness varies from across the tickers – for instance, IWM is much more spiky than others.
In a similar vein, the recovery also differs. For example, NFLX rebounded much more strongly than the others; specifically the May 2020 level, which was higher than the levels before the market drawdown.
Further, correlations vary across different time windows. As discussed later in this article, analysis of windowed correlations can potentially surface trading opportunities to make profit.
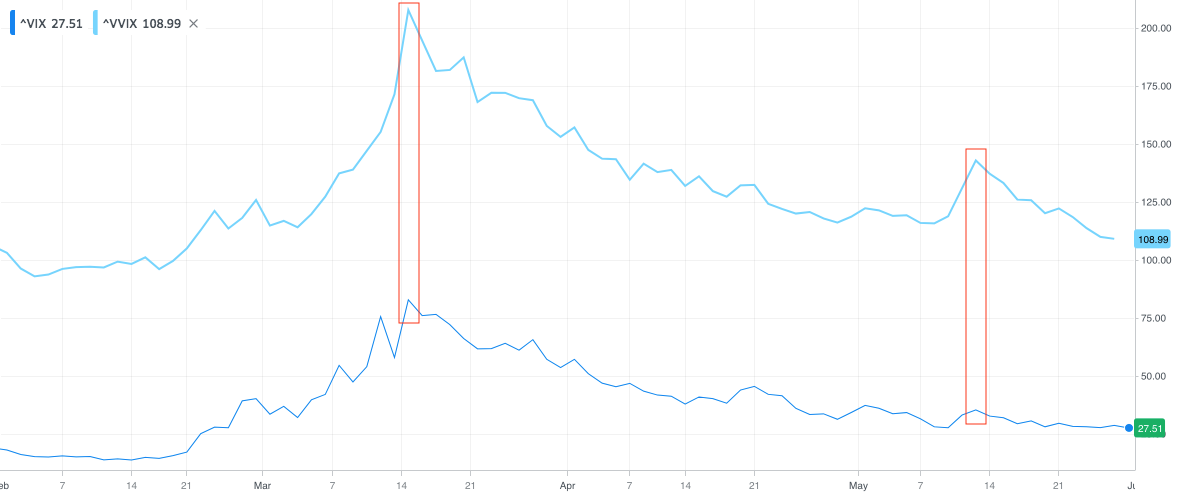
The plot below shows VIX and VVIX (volatility index of VIX, also referred to as volatility-of-volatility) for the same period, Feb. 3 – May 29. From the plot we note that the two indices are highly correlated. However, the ratio of the magnitude of jumps varies significantly over time. For instance, the ratio of the jumps captured by the two red boxes is 2.5x (left) vs. 4x (right). Detecting and capitalizing on such jumps can potentially yield material profits.
On the other hand, there are examples galore where different trading instruments move in tandem with each other; in other words, the respective time series are highly correlated. This is also observed at a global scale as exemplified by the plot below which corresponds to the crash in October 1987. As is evident from the plot, wild swings in daily returns across different geographies were highly correlated. In a similar scenario going forward, if there were to exist geographies where returns were not correlated, it may serve as an opportunity to profit from such market dislocations.
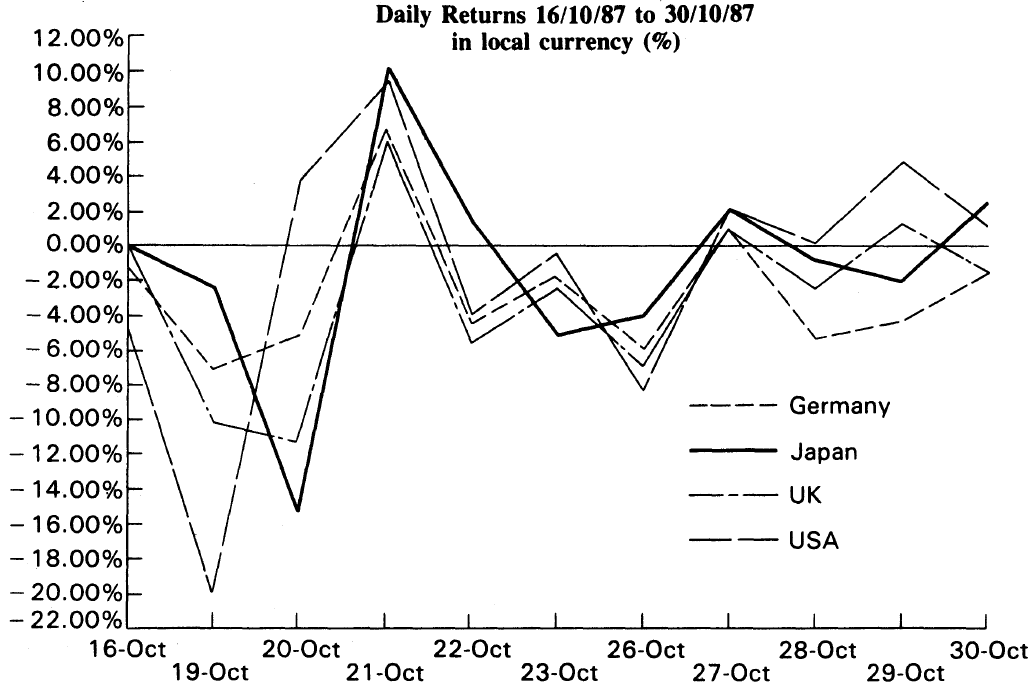
Source: Market Efficiency Before and After the Crash
Being able to, say, forecast a trend, detect an anomalous pattern, establish breakout in correlation between two or more trading instruments can help surface trading opportunities and land home a profit. The latter has been leveraged extensively in the realm of derivatives trading, portfolio management, etc.
This is exemplified by the following trading strategies: (1) empirical correlation trading, (2) pairs trading, (3) multi-asset options, (4) structured products, (5) correlation swaps, and (6) dispersion trading (refer to the work by Meissner for further details). In a similar vein, a large suite of correlation models (refer to the figure below) have been developed to assess financial correlation risk.
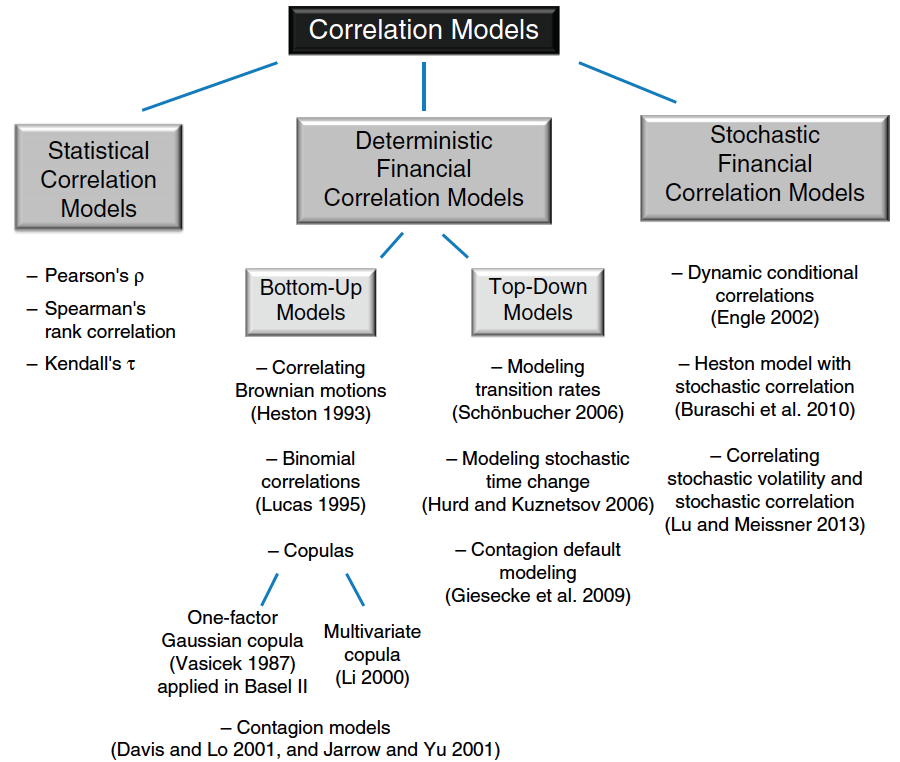
Source: Correlation Risk Modeling and Management
A further breakdown of one-factor and two-factor copulas (recall that copulas allow the joining of multiple univariate distributions to a single multivariate distribution) is shown in the figure below.
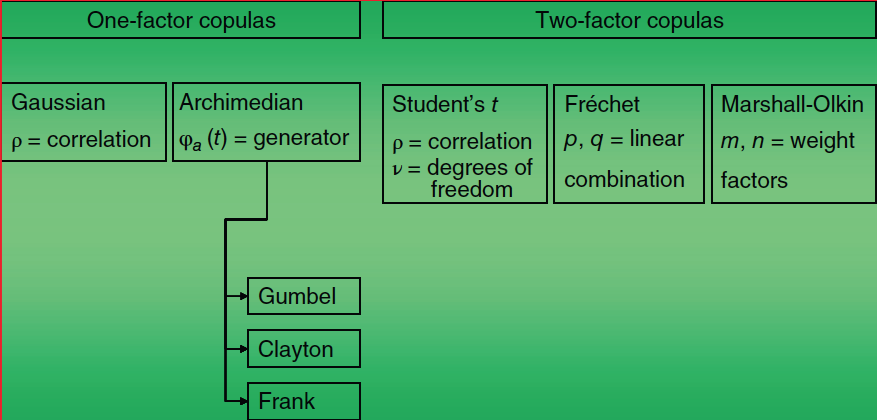
Source: Correlation Risk Modeling and Management
Given the large daily turnover across different assets and different trading instruments, it’s critical to ensure that the input data to the aforementioned models is of high fidelity. Akin to the copulas, it is important to check deviation from the expected data distribution. Deviations can surface in the form of excess kurtosis (see References below) and the impact of outliers. In case of the latter, methods such as trimming (see References) and robust correlation have been proposed, which can be leveraged to drive sound decision-making.
Data in the fintech world has a high degree of stochasticity. Consequently, correlations between different trading instruments also vary over time.Guidolin and Timmermann reported large variations in the correlation between stock and bond returns across different market regimes defined as crash, slow growth, bull and recovery. This has direct implications on the analysis and subsequent structuring of a trade (be it for hedging or be it speculative). To this end, rolling correlations are commonly used to surface the change in relationships over time. For instance, the plot below illustrates the relationship between changes in the cross-currency basis (JPY-USD) and the dollar using rolling correlations.
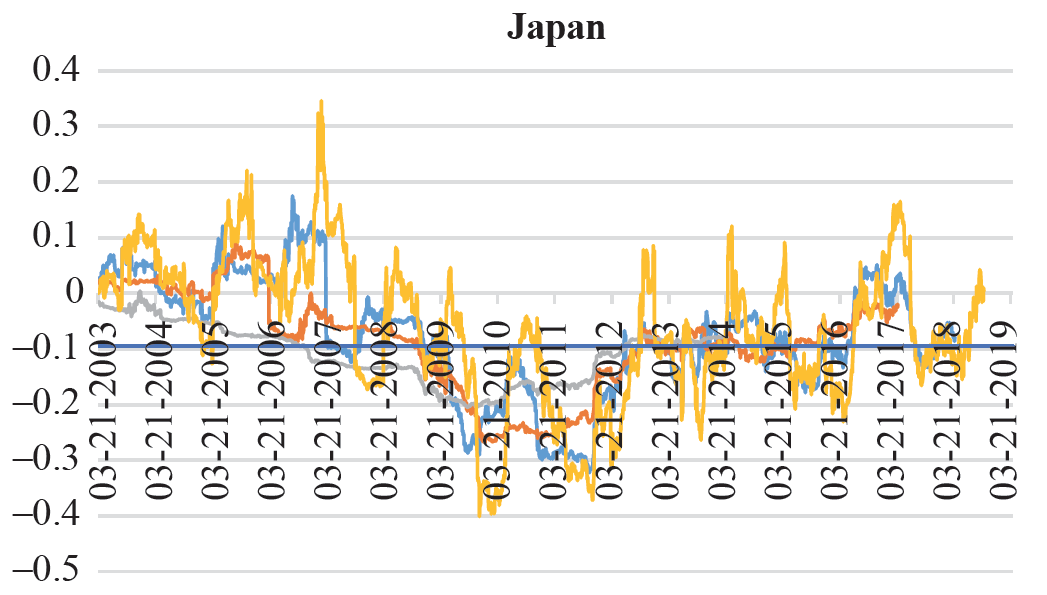
Source: Revisiting the Comovement of Cross-Currency Basis and the Dollar: A Rolling Correlation Approach
From the plot above we note that, the longer the rolling window, the lower the proportion of positive correlation coefficients between changes in the basis and dollar and the higher the proportion of negative correlation coefficients. Having said that, we see that the dynamic relation seems to vary in direction, from negative to positive or vice-versa. In general, such a pattern has implications with respect to optimal and profitable positioning in the cross-currency basis swap markets in the current world of low rates, narrower FX trading range on the back of depressed volatility, and persistent covered interest parity deviations.
A well known trading strategy, called speculative convergence, exploits such deviations. Specifically, if two bases are known to be historically cointegrated (i.e., they move together in levels in the long run), but it is identified that a shock has occurred that has temporarily broken their lockstep movements, causing them to wander in opposite directions, then a potentially profitable speculative convergence strategy would involve:
- Receiving the basis for the basis that has wandered upward (tightened the most)
- Paying the basis for the basis that has plunged downward (widened the most) and
- Finally, exiting both trade positions when the temporary shocks dissipate and previous long-standing relations between both bases become restored
Advanced methods such as varieties of multivariate generalized autoregressive conditional heteroskedasticity (GARCH) have been proposed to estimate correlation between financial variables. Upon estimating the GARCH(1,1) model and employing its resulting standardized residuals, a time-varying correlation matrix is estimated via the DCC(1,1) model. The following figure illustrates conditional correlation, computed based on the DCC model, between gold futures returns and the S&P 500 excess returns against the conditional volatilities of the S&P 500 excess returns. From the figure below we note that the correlation between the two series is reliably negative at -0.18 (t-statistic of -6.55), and from this we can can infer that gold futures contracts possess diversification properties in times of increased market stress.
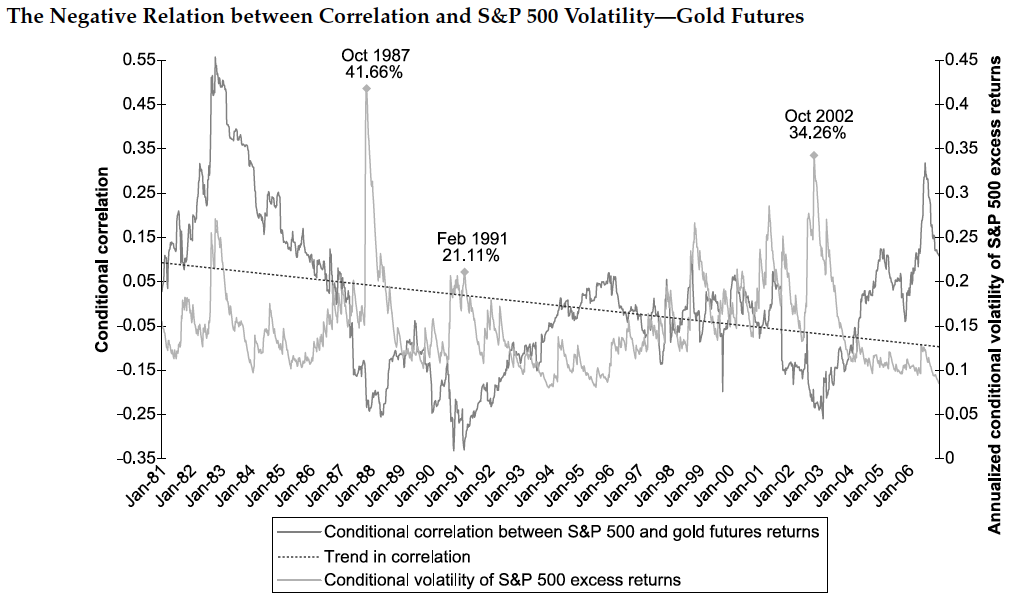
Source: Conditional Correlation and Volatility in Commodity Futures and Traditional Asset Markets
Asymptotic analysis of the change in a correlation matrix can be carried out by leveraging techniques proposed by, for example, but not limited to: Jennrich, Browne and Shapiro and Neudecker and Wesselman.
Correlation analysis plays a key role in assessing the risks associated with the various tranches of a CDO. The capital structure of an index CDO comprises of several tranches with strict loss prioritization. Instead of using a Gaussian copula model to calculate a tranche spread based on a certain set of input parameters, it can be used to determine the implicit correlation which best explains the observed spread of a tranche. As exemplified by the plot below, “implied correlation” is not the same for different tranches of iTraxx Europe series 5 to 7. It is usually lower for mezzanine tranches and higher for senior and equity tranches.
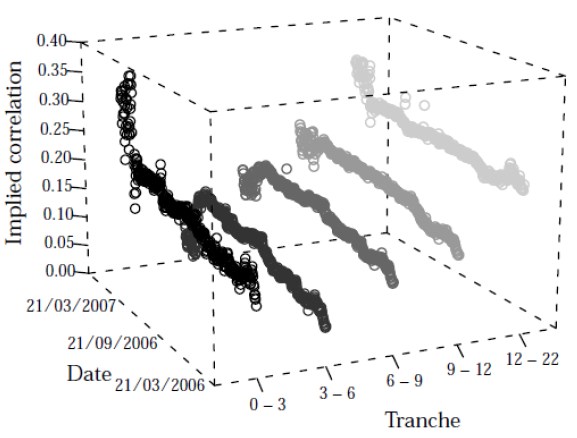
Source: Correlation Smile, Volatility Skew, and Systematic Risk Sensitivity of Tranches
Plotting the correlations in the order of their seniority leads to a curve resembling a smile. A correlation smile is rooted in the fact that the tails of the Gaussian copula model have too little probability mass (See References for more on correlation smile).
In scenarios where there exists an overall correlation, albeit a weak one, it may be useful to investigate directly if the correlation is significantly and substantially more pronounced over a subpopulation. For example in marketing, subpopulations of designated marketing areas (DMAs) in the United States respond differently to TV advertising campaigns, and the identification of DMAs that are sensitive to ad exposure enables efficient spending of ad dollars. To this end, statistical tests (refer to the work by Bamattre et al., for example) can be leveraged to surface heterogeneous correlations, which in turn can be used to structure novel trading strategies.
Data fidelity lies at the foundation of successful execution of the aforementioned correlation-based trading strategies. In the context of incident management, discovering correlations between metrics can facilitate root cause analysis, resulting in a reduced mean time to remediation (MTTR). The benefits to fintech companies include reduction in operational expenses and risk, protection of revenue, and improved customer experience.
Continue this series to discover applications of and challenges with applying correlation analysis in:
- a wider business context
- eCommerce, specifically promotions
- telecommunications, specifically network performance
References:
On excess kurtosis –
Characteristics of Kurtosis by Douglas E. Scates
Is Curtosis Really Peakedness? by Richard B. Darlington
Kurtosis: A Critical Review by Kevin P. Balanda and H. L. MacGillivray
Karl Pearson and the Origin of Kurtosis by Anna M. Fiori and Michele Zenga
Kurtosis as Peakedness, 1905–2014. ‘R.I.P.’ by Peter H. Westfall
On trimming –
A Monte-Carlo Study of Asymptotically Robust Tests for Correlation Coefficients by G. T. Duncan and M. W. J. Layard
Robust Estimation and Outlier Detection with Correlation Coefficients by Susan J. Devlin, R. Gnanadesikan and J. R. Kettenring
Robustness of the Distribution Theory of the Product Moment Correlation Coefficient by Helena Chmura Kraemer
On correlation smile –
Correlation smile matching for collateralized debt obligation tranches with α-stable distributions and fitted Archimedean copula models by Dirk Prange and Wolfgang Scherer
A Note on the Correlation Smile by Svenja Hager and Rainer Schoebel
Implied Correlations: Smiles or Smirks? by , and
Dynamic Modeling of the Correlation Smile by
Implied Correlations: Smiles or Smirks? by , and
Other References –
Combining Heterogeneous Correlation Matrices: Simulation Analysis of Fixed-Effects Methods by Adam R. Hafdahl
Effect Sizes Based on Correlations
Nonparametric Testing for Heterogeneous Correlation by Stephen Bamattre, Rex Hu and Joseph S. Verducci
Volatility and Correlation Forecasting by Torben G. Andersen, Tim Bollerslev, Peter F. Christoffersen and Francis X. Diebold