Written by @InterpretableAI & @IraIraCohen
In the first part of the blog series, we discussed how correlation analysis can be leveraged to reduce time to detection (TTD) and time to remediation (TTR) by guiding mitigation efforts early. Further, correlation analysis helps to reduce alert fatigue by filtering out irrelevant anomalies and grouping multiple anomalies stemming from a single incident into one alert.
In this edition, we throw light on the applicability of correlation analysis in the realm of eCommerce, specifically, promotions.
As we head into the holiday season, it’s a tough time for retailers, especially given the revenue hit incurred by the pandemic earlier in the year. For many, Q4 accounts for more than 50 percent of their annual sales. With the pandemic accelerating digitalization, businesses will face a heightened competitive landscape. One of the highlights of the holiday season, be it Black Friday, Cyber Monday or Christmas, are the online promotions. The figure below illustrates the longitudinal variation in sales with and without an advertisement, and the number of weeks that ad was in circulation.
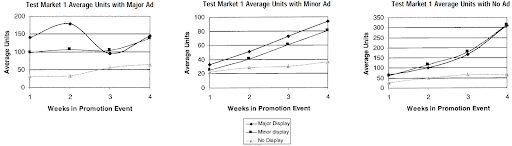
Figure source: Prior work by Cooper et al.
In general, there are many types of promotional campaigns (see below) and each involve a multitude of factors:
- Percentage discounts
- “ABC dollars off”
- Buy One Get One (BOGO)
- Multi-buys
- Holiday promotions
- Loyalty points
- Multi-save (ala, buy and save off the entire sale)
Optimization typically requires a deep dive to correlate the KPI(s) of interest with the various promotional levers.
For instance, which promotion(s) do you offer for which product? For how long? How do you assess the ROI and optimize efficiently? How do you avoid losses? Besides promotion type, another key factor to consider is the surface, whether the ad is running on traditional channels (TV, print, billboards) or on digital (desktop vs. mobile vs. in-app). Further, promotions not only help in boosting sales but also the ratings of mobile apps (it is well known that a higher rating in an app store compared to one’s competitor helps boost install volume).
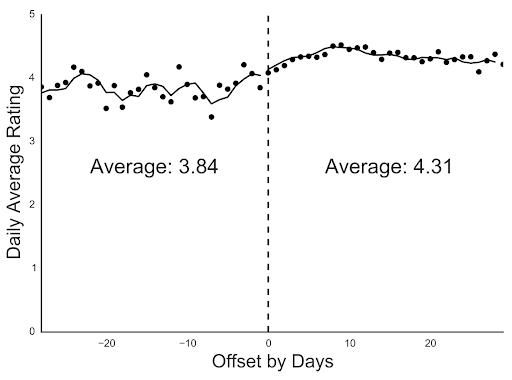
Consider the figure below, borrowed from the work by Askalidis 2018, which illustrates a changepoint induced in the daily average rating by a promotion. Detecting such a changepoint early and surfacing the highly correlated promotions can help inform ad spend (e.g., dynamically adjust budget amongst different promotions).
Before we dive further, one may wonder whether promotions actually help boost the top line as well as the bottom line of the business. A natural line of questioning given how much is being spent on these campaigns:
- According to Forrester, more than 20 percent of gross revenues are invested in trade promotions by global consumer packaged goods (CPG) brands. According the report, promotions help to:
- Defend market share
- Grow the customer base
- Improve success rates for new product introduction
- BCG reports that, every year, fashion retailers globally invest more than $1 trillion in their markdown programs. Further, it was reported that discounts “can boost gross margins by 10% to 20% for in-season and end-of-season sales programs.”
Getting the promotion strategy right is not trivial. A recent report from McKinsey highlighted, “While promotions provide a short-term sales boost, they cannot generate long-term growth because they fail to address new customers, new shopping habits and preferences, or a retail environment undergoing a profound transformation.”
Further, eMarketer found that promotional reliance can actually erode brand equity. To that end, many retailers are harnessing advanced analytics — big data and artificial intelligence (AI) — to develop effective promotion strategies that are appealing to consumers and lucrative for retailers. An AI-centric approach provides a more accurate way to address the dynamics owing to market seasonality, secular trends, personal preferences, inventory constraints and, consequently, enable hyper-targeting in a scalable fashion.
Owing to the factors mentioned above, correlation between different metrics may evolve over time. Detecting a change in correlation patterns, as illustrated in the figure below, can potentially help course-correct and fine-tune an ongoing promotion.

Figure source: Prior work by Cabrieto et al.
No wonder then that Global Market Insights estimates the retail analytics market size will grow at a more than 20 percent compound annual growth rate between 2020 and 2026 and will rake in more than $20 billion.
Promotions can influence consumer purchases in multiple ways, from when and what to buy, to how much to buy, and these are just a few of the dimensions to consider in decomposing campaign efficacy:
- Brand switching
- Purchase acceleration (ala, interpurchase time)
- Boosting shopping momentum
- Boosting impulse purchases
- Stockpiling
- Past promotional purchases may have a negative impact on repurchase probability of the brand\\
In a similar vein, effects of promotions differ between hedonic versus utilitarian purchases. In prior work, it is argued that promotions may help remedy hyperopia (“namely, excessive farsightedness and overcontrol”) for hedonic purchases.
The above mostly capture the impact of promotions in the short term. However, as discussed in the Journal of Marketing Research, there are other factors at play that may result in delayed effects. For instance:
- Delayed response effect: A consumer may not buy a product immediately after seeing a promotion.
- Customer holdover effect: This corresponds to protracted increase in purchase rate of current customers or addition of new customers.
- Anticipatory response effect (or lead effect): Consumers may hold back purchases in anticipation of promotions.
Alternatively, price promotions can have long-term effects on category incidence, brand choice and purchase quantity. The different data points needed for the analysis and the potential concerns that may skew the analysis are discussed below.
- Promotion type
- Promotion surface
- Promotional pricing
- Targeting
- Event, if any (e.g., Thanksgiving, Cyber Monday, Christmas, New Year Eve, Birthday, Anniversary)
- Incremental sales/engagement
- Intent (e.g., is the purchase meant to be a gift)
- Potential concerns
- Timeliness
- Bias, for example, by-region
- Lack of competitive promotions data can limit the efficacy of promotion response models – for instance, it would be difficult to assess the promotion-price elasticity
- Data fidelity
- Sampling and specification error
- Missing data
From above, we note that there are multiple factors at play and, hence, correlation analysis finds a natural fit to determine, as a first-cut, which factor(s) play a key role in driving the top and bottom lines. The ability to identify strong correlations would help marketers to double down on the corresponding promotions. On the other hand, identifying no correlation, or a weaker correlation, would help marketers dive deeper to carry out root cause analysis in a more targeted way.
To illustrate, consider the figure below, which shows how two correlated anomalies – a spike in page views and add to carts – for an eCommerce site points to an anomalous sales pattern. The shaded area (the baseline) is the normal pattern of sales for a promotional event of this nature.
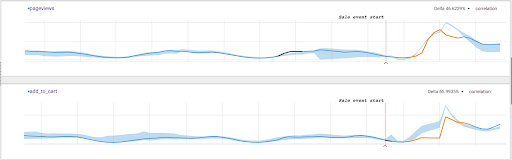
Clearly, the add to cart metric is underperforming. Correlating the relevant event (the sale) and the related metrics (page views and add to cart) together, it underscores the irregularity of a drop in both those metrics.
When the event started, the team was alerted about the fact that the sales event did not yield the expected increase in both the correlated metrics; in fact, page views actually dropped(!) 46 percent compared to the expected spike, leading to a drop of 66 percent in add_to_cart. These drops were identified because the effect of the sales event (an “external” variable to the metric), was correlated to the values of the metric. If the correlation between the metrics and the event was not taken into account, the drop would have seemed like an increase.
Multivariate correlation analysis helps to throw light on how the dependent variable (say, incremental sales) is associated with other independent variables. In the current context, the challenge is that some of the variables may be discrete (they may arise owing to, for instance, one-hot encoding of categorical variables) and some may be continuous. To this end, we suggest employing techniques such as those proposed by Olkin and Tate, and Cox, along with several others:
- “A Test for Serial Correlation in Multivariate Data”, The Annals of Statistics
- “On the Use of the Inverse of the Correlation Matrix in Multivariate Data Analysis”, The American Statistician
- “A Linear Combination Test for Detecting Serial Correlation in Multivariate Samples”, Institute of Mathematical Statistics
- “Correlation Analysis for Exploring Multivariate Data Sets”, IEEE
Some of the measures for capturing multivariate correlation include multiple correlation, unsigned correlation coefficient (UCC) and the unsigned in correlation coefficient (UIC).
Further reading
For more about price promotions, scheduling promotion vehicles and to dive deeper in promotion optimization, we suggest reading:
- “How price promotions work: A review of practice and theory”, Handbook of the Economics of Marketing
- “Promotion Optimization in Retail”
- ‘Scheduling Promotion Vehicles to Boost Profits”
Continue this series to discover applications of and challenges with applying correlation analysis in:
- a wider business context
- telecommunications, specifically network performance
- fintech, specifically algorithmic trading