The difference between the two comes down to proven quality
A couple of months ago we released the all-new Anodot.com. Following the release, I explored our Google Analytics account to see what had happened post-launch.
I have always been ambivalent about Google Analytics. On the one hand, the service has helped shape web analytics as we know it today and is used by nearly every website. Not to mention it’s free and rather easy to consume. On the other hand, GA is never a slam dunk. Data quality is low due to sampling, understanding the flow is practically impossible, data latency is not clearly defined, and support is nonexistent.
So when, a little over a year ago, Google Analytics launched its anomaly detection service, I found myself apprehensive that the platform could pull it off. As someone who’s an analytics freak and very familiar with GA, I doubted that they had the AI and machine learning needed to take on AI analytics. It’s a big claim. The opportunity was clear – AI could potentially reduce the noise created when using manual thresholds and filter the most critical alerts. Having algorithms rather than humans monitor big data suddenly makes it possible to track millions of metrics – in real time. But, based on past experience with GA, I assumed the quality would be questionable.
Anodot, and as we corner the AI analytics market we often find ourselves answering the ubiquitous question, “I have Google Analytics. How is Anodot different?” So I pitted the two platforms — Google Analytics and Anodot Autonomous Analytics — against each other in anomaly detection on our site’s KPIs. Here’s what I discovered.
Did any important anomalies gone unnoticed?
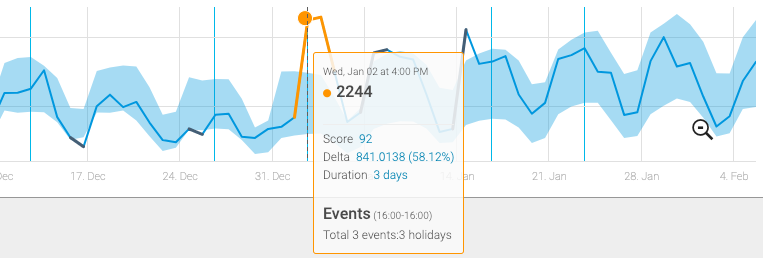
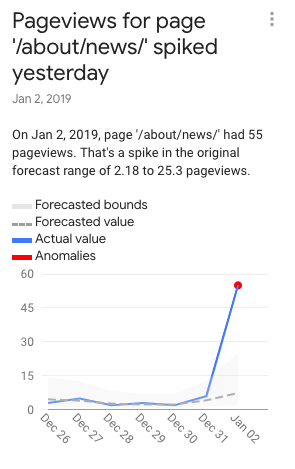
GA chooses a handful of anomalies to report. The logic behind what is reported and what isn’t is unknown. In my case, GA failed to report a 58 percent spike in the number of website visitors and, in general, only reported a few anomalies when Anodot detected tens of anomalies.
Which created a tighter baseline? Which is a better listener to behavior?
The idea behind anomaly detection is to learn the norm. The better the algorithm can learn the more likely it can truly filter out noise and find important aberrations within a metric. The baseline on anomaly detection represents the baseline for how a metric normally behaves. The width of the baseline can tell you a great deal about the system’s quality of learning. When the baseline is wide, important incidents can go unnoticed. A baseline that’s too wide absorbs many of your outliers or anomalies within the definition of normal behavior. Basically, it leaves you at risk.
For the anomalies GA surfaced, the baseline was three times(!!) wider – thereby three times less precise – than what Anodot created (shown below).
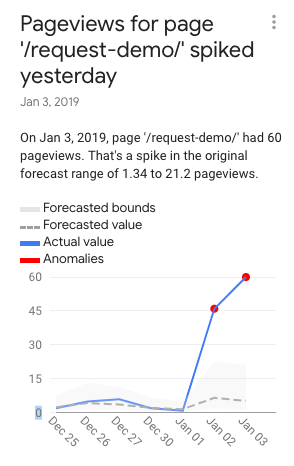
Google Analytics pageview anomaly – baseline extends between 0 -15
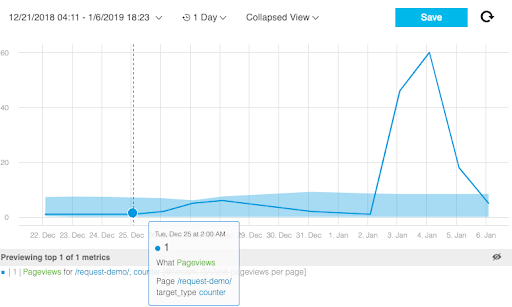
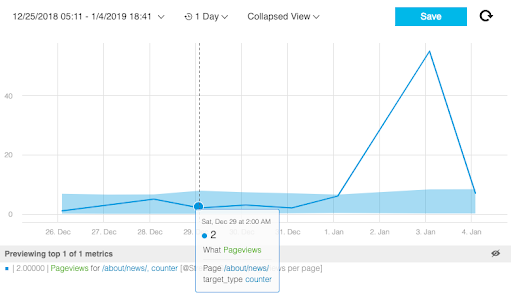
Anodot pageview anomaly – baseline extends between 0-5
Google Analytics news page anomaly – baseline extends between 0 -15
Anodot news page anomaly – baseline extends between 0-5
It’s also important to notice what happens after the anomaly occurs. See that the Anodot baseline practically doesn’t move, whereas the GA baseline expands by 60-90 percent. Why? Anodot took more factors into consideration and didn’t adjust the baseline primarily based on the metric’s most recent behavior.
Which does a better job of shortening time to resolution?
The main reason for getting an alert is to reduce time to resolution. The best solutions usually guide the customer to the source of the problem so they can fix it faster. Google Analytics doesn’t have that capability – it simply leaves you with the understanding that something is wrong. Anodot correlates anomalies from different metrics, in addition to related events and factors into one comprehensive alert. This reduces the overall noise and generates a more comprehensive story to reduce time to detection and time to resolution.
When running a large-scale operation, it is irresponsible to manually monitor your business and not take advantage of the continuous monitoring AI affords. At any given time, you leave your company exposed to losing a significant percentage of daily revenues.
Every day, business lose anywhere from hundreds of thousands to millions of dollars – and rather quickly, too – from glitches and outages. Here are only a handful of recent examples that made headlines:


In today’s data-rich environment, anomaly detection becomes a norm. It is the only way to scan all your data and limit notifications to what’s important. More companies are offering anomaly detection as part of their product stack. Settling for poor anomaly detection capabilities will just create more noise — something any team striving for efficiency should avoid. Choosing an accurate anomaly detection platform, which you can trust, will allow you to focus on building your business while enabling great customer service.


