In most SaaS applications – and Anodot is no different – the software stack consists of multiple cluster components that scale in or out depending on the need.
Monitoring the cluster, and in particular issue tracking, becomes more challenging as the cluster grows: while it possible to monitor each node on a 10-node cluster in a monitoring dashboard, it is overwhelming to view 20 or 100 nodes. Moreover, setting static thresholds or doing anomaly detection per each node is impractical as the behavior of each node changes continuously, and the change pattern is sometimes unnoticeable.
A typical way of solving this would be to create aggregation functions to track the main KPIs or time series over the entire cluster, such as the Sum or Average of various cluster resources (e.g., average CPU utilization), and track the aggregated time series to detect issues within the cluster. This makes sense because the cluster works as a cohesive unit, with all nodes working in concert.
In most cases this method works well, however, in cases where an issue in a single node does not impact the total aggregated result, critical issues might be missed. This is exactly what happened to us.
Real Life Example of Misleading Cluster KPI
Recently we upgraded our Cassandra from 2.0 to 2.1 and found that the cluster was unstable. We were experiencing intermittent performance issues, for example sometimes requests were timing out, or reads were failing.
Our main KPI hadn’t changed much: R/W latencies were good, Mutations and Coordinators aggregated throughput stayed the same, no issues were found with pending compactions, memtable flushes, SSTables were all in a good state.
Nevertheless, we did notice that some nodes worked harder than others. We discovered this while we drilled to check per node Load Average on our main Dashboard. Clients were receiving timeout errors as a result. We knew there was a problem but we had no idea what was the root cause.
Enter Anodot’s Outlier Detection
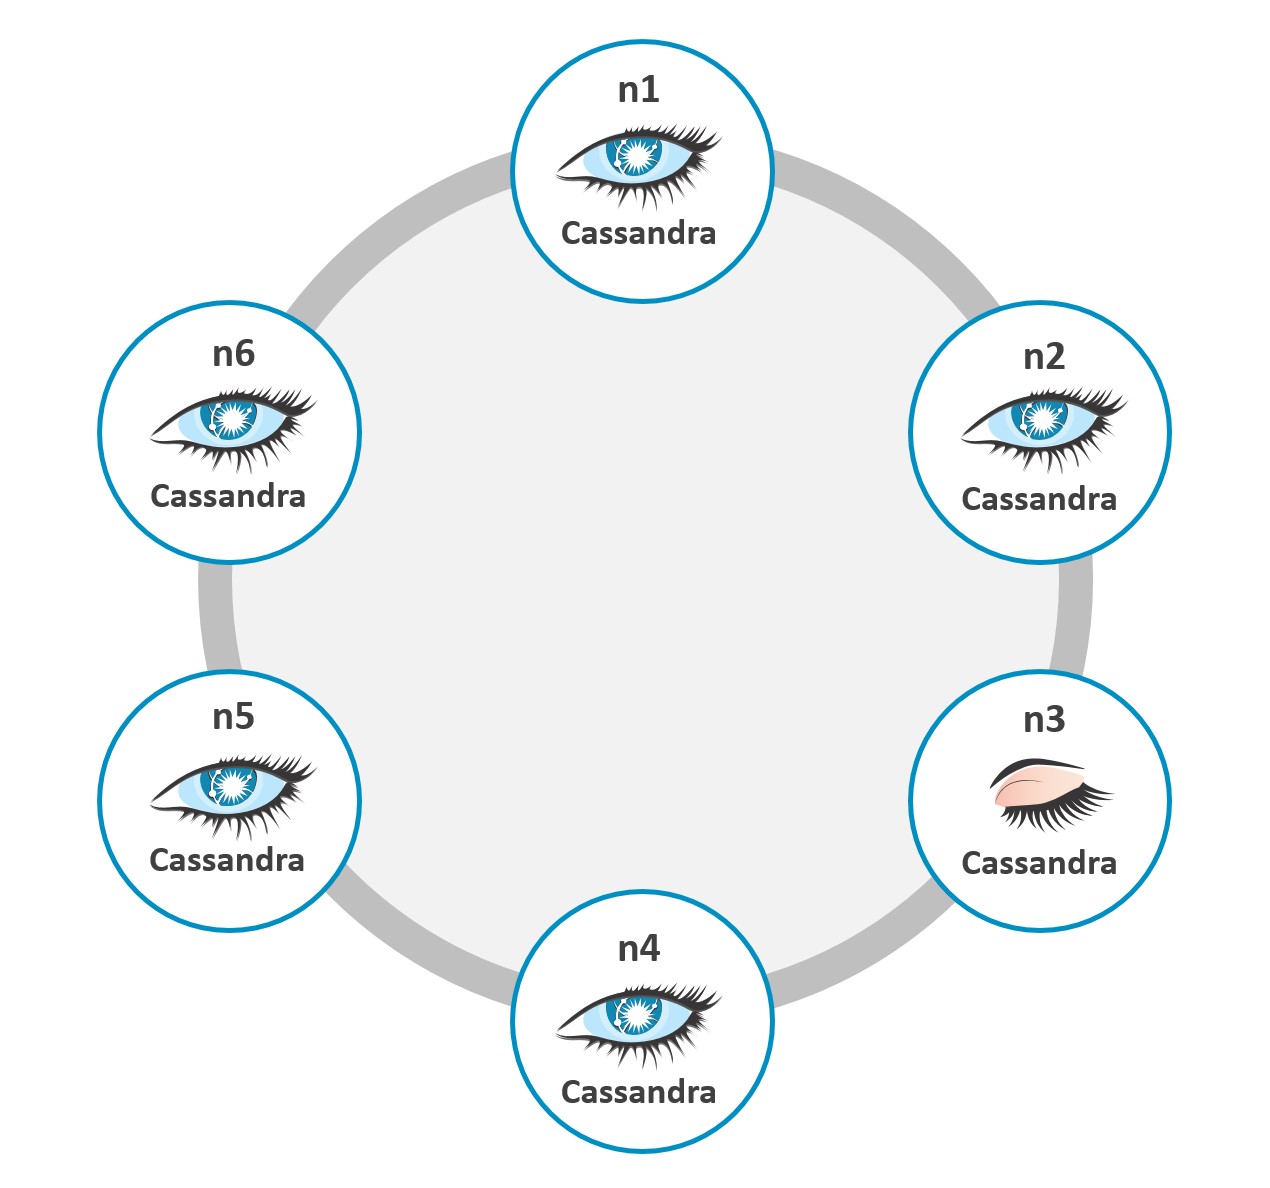
Cassandra is known for its linear scale, and efficient data distribution where each node in the cluster shares the same role.
Luckily we were able to use our own automatic outlier detection, which compares things that are supposed to behave similarly and identifies the ones that are behaving differently. This is often used in factory situations where there are multiple machines that are supposed to have similar readings (temperature, output, etc.), to determine if any of the machines require maintenance.
In our case, we activated an automatic outlier detection alert on the cluster’s SEDA (Staged Event Driven Architecture) time series, which included the Mutation Stage, Request Response Stage and Read Stage, and this is the resulting alert that we received:
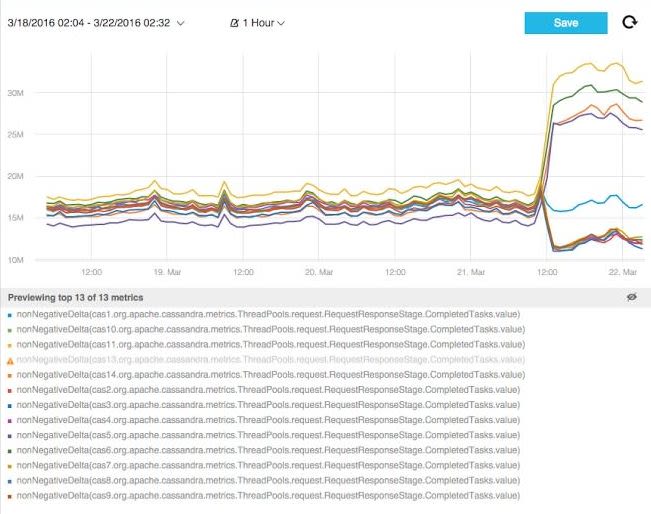
The outlier in the Read-Response stage clearly pointed to the fact that the client requests were not being divided equally among the nodes in the cluster. This, in turn, led us to the conclusion that the Cassandra Driver that we were using for Cassandra 2.0 was broken on Cassandra 2.1.
Apparently there was a known bug in the Datastax Driver that we were using – Datastax 2.1.0 – which caused nodes to become undetectable after restart, which meant they would not participate in the coordination tasks.
We had not detected the bug in our staging and testing environments, as we had not applied outlier detection alerts there.
After replacing the Driver with a newer version, the cluster came back to the normal behavior and the traffic was evenly balanced.
The Bottom Line: Monitor Cluster KPIs But Don’t Overlook Outlier Detection
In many cluster environments, nodes in the same cluster share the same characteristics and output similar KPIs. While it’s OK to treat the entire cluster as a unit for the purpose of monitoring and anomaly detection, there are times when it becomes crucial to identify outliers within the cluster, and Anodot’s outlier detection can help with this. If you’re interested in learning more, contact an Anodot specialist with any questions or if you’re interested in seeing a demo on your data.


