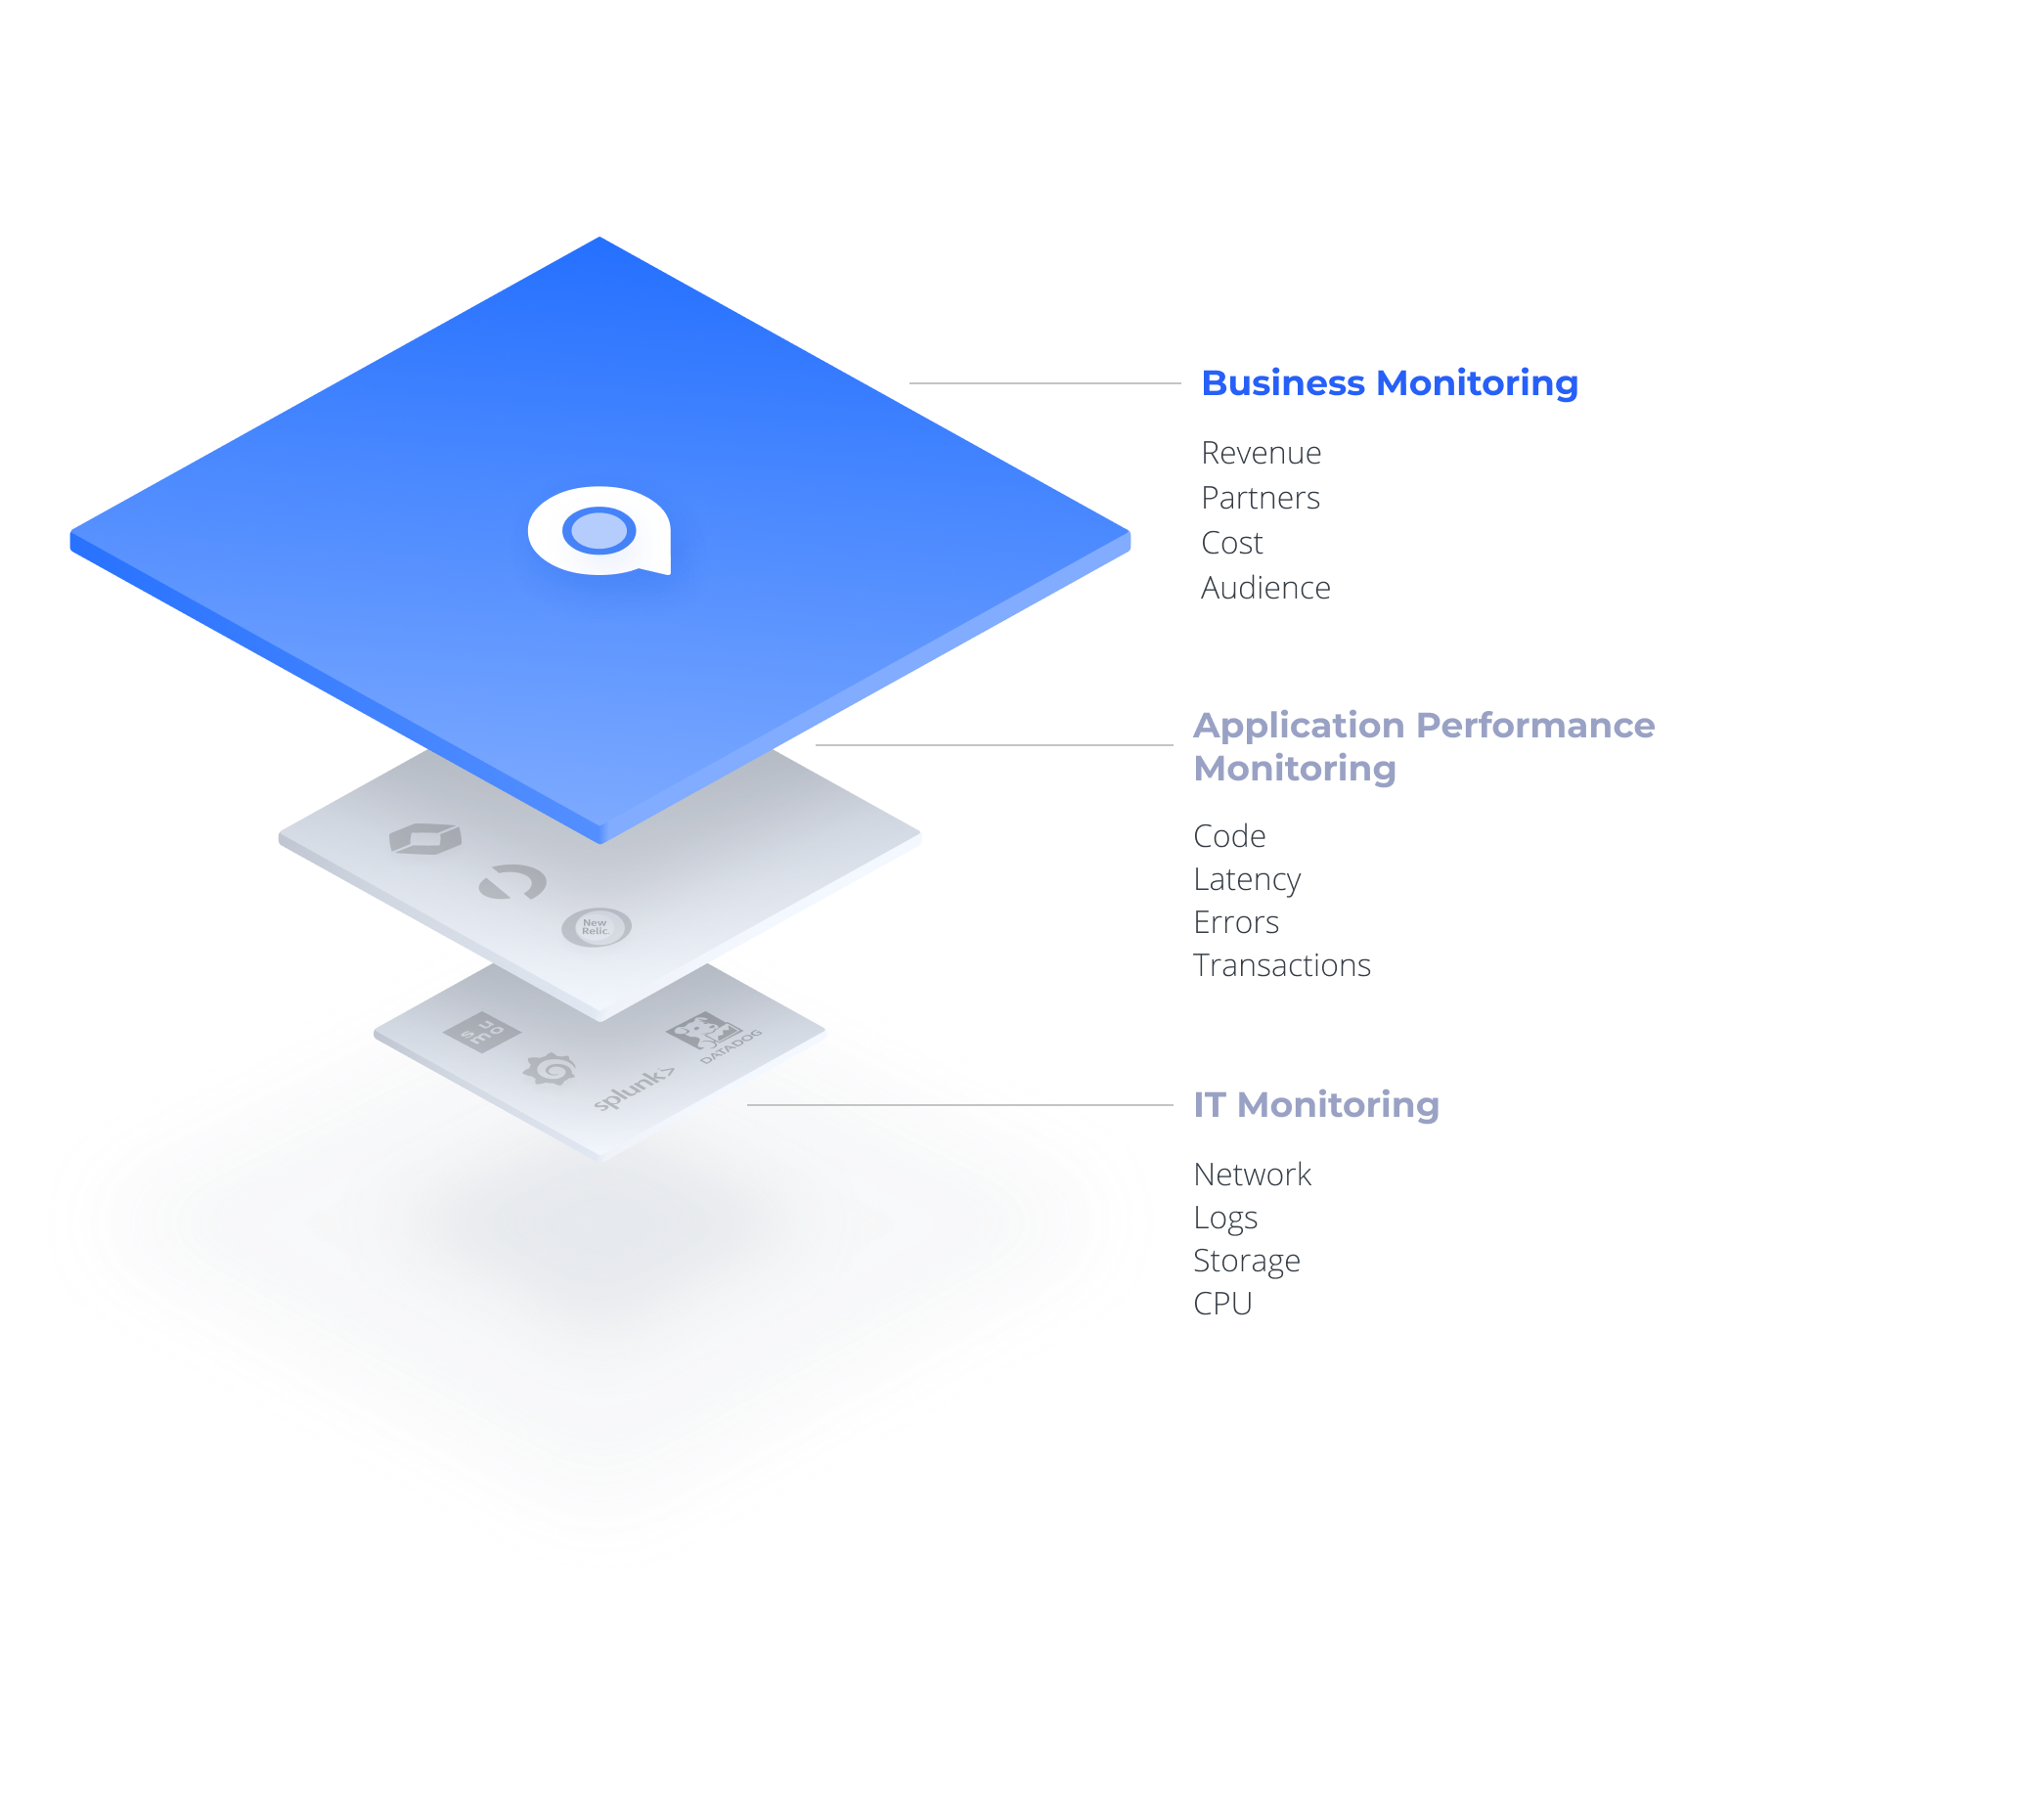
Many companies today try to feed business metrics into APM or IT monitoring systems. Splunk, Datadog and others track your business in real time, based on log or application data – something that would seem to make sense. In practice, however, it fails to produce accurate and effective monitoring or reduce time to detection of revenue-impactful issues.
Why?
Because monitoring machines and monitoring business KPIs are completely different tasks.
Monitoring Machines vs. Monitoring Business Metrics
When we think of monitoring, the first thing that comes to mind is heart rate monitoring. What is needed to monitor a heart condition? There are some simple rules to define what is legitimate and what isn’t. For example, if you’re over 18 years old, having a pulse between 60 and 100 is good – anything higher or lower than that and there’s a problem.
Disk storage follows the same concept. If you’re below 70% of disk space, all is good. If not? Alert me.
The Limitations of Static Thresholds for Business KPIs
This is why static thresholds are so effective. They’re easy to understand and always keep us on the safe side – alerting us only if the metric we measure is at risk. When we monitor machine metrics or well-defined situations we can use static thresholds to only be alerted on outliers. That doesn’t work for business KPIs, which require context.
For example, when do you want to be alerted on a spike in logins? This can be hard to define. It depends on the number of logins you expect and it may also be different for countries, operating systems, applications, hours of the day, holidays and other segments and events.
Why are business metrics different from machine or application metrics?
First, context is important. When we examine active users we may want to examine the metric’s seasonality – how it compares to the same time in the previous few weeks, whose expected value fluctuates depending on a variety of factors.
The expected value is relative to the metric history. Business metrics are human-dependent. In most cases, business metrics are heavily influenced by human behavior, which is seasonal (day and night, weekday and weekend). For example, when I monitor data consumption on a telco network I cannot set static thresholds. During the night very low consumption is fine but during the day I would expect higher consumption rates.
Second, business topology is unknown. When I monitor machine data I know what the relationship is between different machines. When monitoring business data, we can’t do that. We need the algorithm to learn relationships and correlation between the different metrics.
Third, business sampling rate is irregular. When monitoring machines, we’ll get a new data point every x seconds as long as the machine is alive. This is not the case for business KPIs. We may have full minutes and even hours without a purchase or a click. The business sampling rate is irregular; it requires significant adaptation in how data is stored and how the algorithm works.
In short, when monitoring business metrics, static thresholds are not smart enough. If I choose to use static thresholds it would necessarily result in a significant number of false-positive alerts. Business metrics such as user activity, quality of service, revenue and the like are highly affected by seasonality and are harder to learn and understand.
So what can be done to monitor a business? What is the right method to choose? With the rise of machine learning (ML), it’s possible to use algorithms that actually learn the behavior of metrics and understand when something goes wrong.
5 must-do guidelines for monitoring business metrics
Based on our experience in building a SaaS product focused on monitoring business metrics, we defined 12 crucial guidelines for how to design such a system. The top five are listed below, and all can be seen on Anodot’s .
- Identify various signal types – Business metrics have various signal types. Learning every metric’s normal behavior is a prerequisite to identifying anomalous behavior. You’ll want to use sequential adaptive learning algorithms on the fly that initialize a model of what is normal, and then compute the relation of each new data point going forward. Even well-known models such as Double/Triple Exponential (Holt-Winters) or ARIMA require modifications to allow sequential learning. To monitor business metrics you’ll develop a sequential update for all model types that are used for the various metric types.
- Monitor 100% of the data in real time – Significant anomalies can occur in various metrics and “business depths”. Don’t just monitor top line revenue however. Revenues should be monitored per product, country, technology and also technology + country, product + technology and product + technology + country combined. This should be done across multiple layers of business data, to achieve a watertight solution. It should correlate between disparate anomalies to report on incidents in context, requiring complete data coverage. Make sure to analyze 100% of the business’s metrics in real time and at scale by running machine learning algorithms on the live data stream itself, without reading and writing to a database.
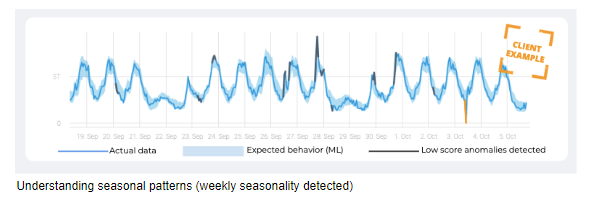
- Detect seasonality – The two most common methods for determining baseline and seasonality patterns are Fourier transforms and ACF (Auto-Correlation Function). Fourier transforms are efficient but sensitive to missing data and multiple seasonal patterns. ACF does better, at a steep computational complexity cost. Anodot’s patented Vivaldi method is based on the more accurate and robust AFC, but uses smart subsampling to reduce computational complexity. As opposed to auto-learning of normal behavior, auto-learning of seasonality can be done offline. We use a Hadoop cluster to efficiently run the algorithm daily on hundreds of millions of metrics.

- Anomaly Score – Grading anomalies is critical for filtering alerts by significance. Alerts are scored according to deviation, duration, frequency and other related conditions. But results achieved with statistical tests—which score anomalies only relative to normal—aren’t finely-tuned to the business’s needs. That’s because people tend to perceive anomaly significance not only relative to normal but also relative to each other. Anodot’s patented anomaly scoring method runs probabilistic Bayesian models to evaluate anomalies both relative to normal based on their anomaly pattern, and relative to each other, to arrive at a more accurate score.
- Feedback loop – As smart as your ML system may be, business context is hard to crack. Getting feedback from end-users is priceless for running and improving your detection capabilities. This is also the most efficient way to measure the quality of what you built.
So now we have a better understanding that business metrics are completely different from machine metrics. Thinking about this further, why do you actually monitor machines? Wouldn’t it make more sense to focus on the business to begin with?
We can show you how ML learns business metrics. Upload a CSV file and see how can it be learned and what anomalies are detected using our Taste of Anodot. Give it a try and see what you can discover.


