
You place your mug on your desk and boot your computer. Like every morning, you skim over various dashboards on one screen and sift through your email alerts on the other before you start pulling the regular reports.
But this morning turns out to be nothing like other mornings. It is about to take a mean twist that will keep you from ever finishing your morning coffee.
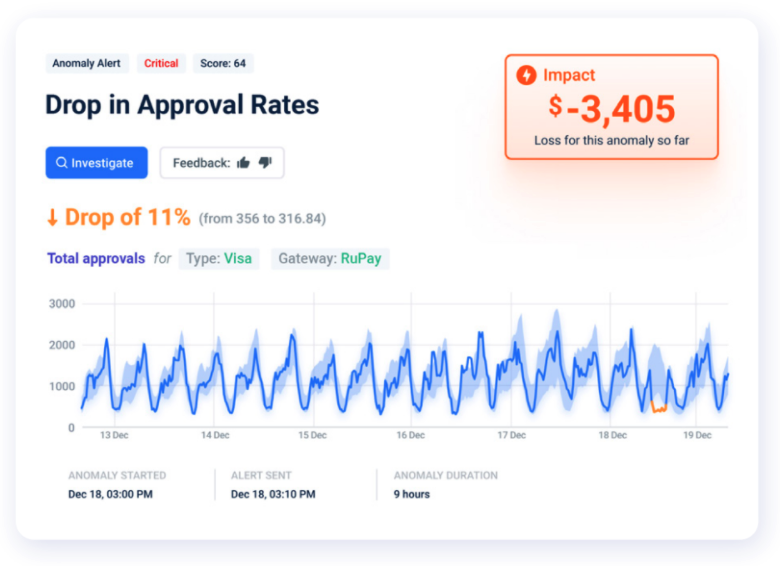
As your eyes run over the payment dashboard you realize there was a huge drop in transaction approvals overnight. You sit down slowly, rub your eyes, and secretly hope it’s a mistake. What in the world has happened? It takes a minute to get your thoughts together.
When Dashboards Fail: A FinOps Nightmare
Where is the failure? How much money is lost? Which merchants are affected? What will account managers say? A scenario like this can’t be ruled out in any company relying on dashboards to monitor payments and transactions.
Dashboards help FinOps, BI, and commercial teams visualize business activities to ensure the payment ecosystem is running smoothly. However, as the amount of data to collect and monitor increases, the efficiency of traditional dashboards for digital payments monitoring becomes questionable.
Why is payment transaction monitoring using a dashboard insufficient?
1. Siloed monitoring and disconnection of data sources and teams
Business units monitor their data separately, gathering from various sources using different tools to cope with the abundance of data. This stifles collaboration and hinders comprehensive analytics efforts.
In our little story, you are completely in the dark regarding the incident’s causes or impact. You need to start involving programmers, IT, finance and product to get to the bottom of the issue.
2. Lack of granularity and context
A dashboard monitors specific metrics separately but can not provide information on if and how specific data behavior might be related. You could be facing a software failure, configuration error, or malicious fraud. It’s up to you to connect the dots and gather clues. But time is critical. With every passing minute, the company loses money directly on unaccomplished transactions and indirectly on the time analysts and developers spend on the investigation.
3. Alert storms and false positives
Alerts assume a respectable position next to dashboards in payment systems monitoring. However, the more data comes flooding in and the more agile it becomes, the higher the chances of false negatives and false positives. Alert storms are becoming normal. It’s easy to understand how a failure like the one in our example virtually vanishes among the influx of alerts.
4. Retroactive monitoring and static thresholds
A dashboard monitors historical data. Thresholds and alerts are defined by past data behavior. Therefore, every time market or user behavior patterns change, the settings and definitions are no longer valid.
Also, each metric has regular data fluctuations, which are overlooked by static thresholds. Just imagine the same story, with the drop in payment approvals remaining within the normal range because transaction numbers are usually the highest at the time in question. You wouldn’t even get an alert, and a lot more time would have passed till you realized something was wrong. It might even take a customer complaint to identify the glitch.
5. Extensive manual work
Thresholds require manual adjustment. Additionally, each business unit focuses on its unique operational needs and goals. Extensive manual work is necessary to get the whole picture and understand the connections in data behavior. Teams end up filtering, organizing, prioritizing, and comparing data on excel files.
The coffee in our example has long gone cold, and you are still busy downloading the relevant reports that help you figure out who needs to be informed about what and which steps to take.
6. Human errors
So much manual work is not only time-consuming but also leaves much room for human errors.
How to Save Time and Cost with Smarter Digital Payment Monitoring
1. Gain control over data volume and complexity
The amount of data to monitor is challenging for dashboards but not for AI-driven platforms. Machine learning capabilities also add a level of autonomous data processing, identifying patterns, similarities, and connections in data from various sources in various formats.
The insights answer actual questions that come up in the initial examination. It takes out a lot of guesswork and points you in the right direction. You’d be surprised at the amount of time you save and the stress you avoid.
2. Connecting and correlating data for higher resolution
A tool that monitors 100% of your business data and isn’t limited to the preferences of a specific business unit can bridge the gaps between teams and data silos, provided it correlates all data points to identify connections in data behavior.
Now imagine, the system synchronizes the plunge in payment approvals with data from other teams’ sources and detects a simultaneous drop in server activity. You see the position this puts you in? Instead of pulling the emergency brake and getting the entire company on board to solve the crises, so you don’t lose any more money, you’d tell IT to redirect traffic towards the affected server. Transactions would run smoothly within minutes again, and the relevant team could investigate and fix without the extra pressure of financial loss and loss of customers’ trust.
3. Accurate alerts – no more thresholds
There’s a better way to identify anomalies in data than static thresholds. Your payment monitoring dashboard tool is happy as long as metrics are within the defined normal range. However, to get a precise assessment of what normal data behavior looks like, you need to consider time-specific and seasonal fluctuations.
By recognizing regular patterns in every metric, the machine learns what is normal for which metric at which time. Real-time data monitoring becomes significantly more precise and eliminates irrelevant alert noise.
4. Real-time monitoring
There are many factors causing transaction and consumer behavior to shift frequently: your business expands, your competitors change strategies, and new trends emerge. A monitoring tool that autonomously adapts to the new normal without the need to administer manual work can reduce uncertainty, time, and effort. With an AI-driven tool such as Anodot, you stop pivoting endless excel files and leave it to the tool to learn and make the necessary adjustments.
Combining the above, you understand how much manual work becomes obsolete when you start using an AI-driven tool. At the same time, the chances of human error are reduced.
Payment Transaction Monitoring With Anodot
Anodot monitors all your business data and correlates data into actionable alerts classified according to severity and financial impact.
Prioritization
Anodot correlates real-time data and can therefore pinpoint the affected business areas and predict potential operational and financial impact. This allows for the prioritization of each alert. Moreover, you can rank alerts, so the system only shows what truly matters to you.
Actionable Alerts
Anodot goes yet a step further. In addition to receiving an alert, you can instruct the software to effect a defined action in a specific event. By configuring actionable alerts for critical incidents, the system prevents significant damage to the business. In other words, in case a server failure is detected, the system would redirect all traffic to an alternative server based on your API instructions.
A Happy Ending with Anodot
Let’s rewind to the coffee mug on your desk.
You quickly recover from your shock. The combined incident alert tells you that traffic from a specific vendor’s server in Iceland failed at 3 a.m. The immediate necessary action – before investigating further – is to redirect traffic to another server.
Oh wait, that’s already taken care of by an actionable alert.
You experience minimum financial loss because traffic was directed within minutes of the incident, customer experience remained unaffected, and operations keep running. What’s left is to find what caused the failure in the server and fix it. But that’s a job for the technical team.