
From the heights of oceans tides each hour, a company’s daily sales revenue, or a country’s annual inflation rate, time series metrics play an extremely important part of our everyday lives.
Read on to better grasp:
- What are Time Series Metrics?
- The Different Types of Time Series Metrics
- Examples and Use Cases of Time Series Metrics
- Summary: Time Series Metrics
What are Time Series Metrics?
A time series is a sequence of sequential data points that occur over a particular interval of time. A “metric”, in this case, refers to the piece of data that is tracked at each increment of time.
A time series metric has two main features:
- Measurable: this means that you can assign a numeric value to it
- Variable: this means the metric changes over time
One important difference about time series data is that time is not just a metric (like the piece of data being collected), but rather it is the primary axis. This means that each numeric data point is paired with a timestamp and one or more labeled dimensions associated with the metric. It should be noted that the time intervals between each data point are most often gathered at regular intervals, although they can also be irregular.
Time series also consists of 4 main components:
- Level: this refers to the average, baseline value of a time series as if it were a straight line
- Trends: this means that variations in the data move up or down in trends or reasonably predictable patterns.
- Seasonality: this means that there are seasonal variations that repeat over a specific time period, for example, each day, week, month, or year.
- Variability: also known as “noise” or “volatility” ”,this refers to random variations that don’t fall into any of the other three categories.
The Different Types of Time Series Metrics
Now that we have a high-level definition, let’s look at a few of the different types of time series metrics.
Univariate Time Series
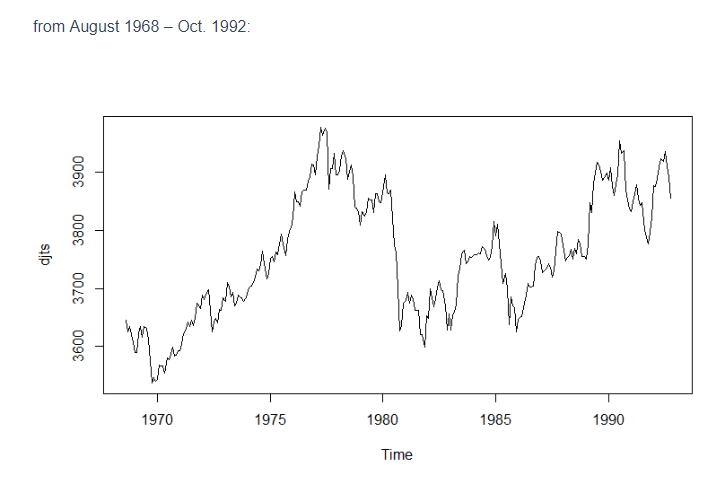
Univariate time series refers to a type of time series that consists of a single observed value that is recorded in sequential order with equal or non-equal time intervals. When you are modeling a univariate time series, each metric represents changes in a single time-dependent variable. For example, the following image from Quantisti demonstrates a univariate time series of the Dow-Jones Industrial Index from August 1968 – Oct. 1992:
Multivariate Time Series
Multivariate time series refers to data that has more than one time-dependent variable. If there are just two time-dependent variables, this is referred to as a “bivariate time series”. In a multivariate time series, each metric has some dependency on the other variables. For example, in the following image from Machine Learning Mastery we can see a multivariate time series with 7 subplots of time series data that are used to forecast air pollution.. In this example, each of the variables has some dependency on each other and can all be used together to predict air pollution in the following time steps.
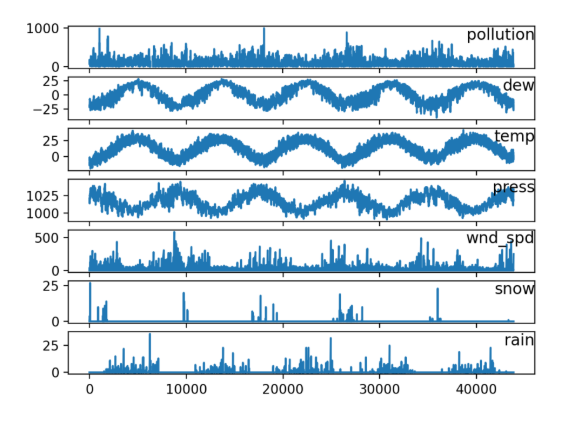
Source: Machine Learning Mastery
Time Series Metrics for Time Series Databases
One common application of time series metrics is for monitoring systems and time series databases (discussed further below). For example, Prometheus is an open-source time series database which offers four core metric types including:
-
- Running counter: this is a cumulative metric that represents a single, increasing counter that preserves the given order.
- Gauge: This is a metric for which each data point represents an average of all measurements within the data point time window. A gauge is typically used to measure things like average temperature in the last day, average response time in the last hour or your computer’s average memory usage in the last minute.
- Histogram: this metric samples from the observations and counts them in configurable buckets, and also provides a sum of the observed values.
- Summary: this metric also samples from the observations and provides a total count, a sum of all the observed values, and calculates configurable quantiles over a sliding time window.
Examples and Use Cases of Time Series Metrics
Now that we’ve reviewed the different types of time series metrics, let’s review several examples and use cases of them.
Time Series Anomaly Detection & Forecasting
One of the main applications of time series metrics is for time series analysis and forecasting:
-
- Time series anomaly detection : this refers to data mining techniques that are used to detect outliers in a dataset . Anomaly detection has many real-world applications – from business monitoring, fraud detection, medical anomalies and cyber attack prevention. Examples of business monitoring use cases include revenue monitoring, cost monitoring and customer experience monitoring.
- Time series forecasting: the use of models in order to predict future values based on previously observed data. For example, eCommerce companies often use time series forecasting to forecast demand so they can plan their inventory and budgetary requirements
Five of the most important concepts for time series anomaly detection and forecasting include:
-
- Seasonality: The presence of variations that occur at regular intervals is very common in real-world datasets and identifying these patterns help improve our anomaly detection and forecasting efforts.
- Stationarity & Non Stationarity: A common assumption for time series techniques is that the data is stationary, which means that the statistical properties such as the mean, variance, and autocorrelation are constant over time.Conversely, non-stationary time series refers to data whose statistical properties change over time.
- Trends: understanding if upward or downward trends are present over certain periods of time are an important part of forecasting and detecting anomalies in a data set.
- Temporal Pattern Analysis: Temporal patterns refer to a segment of signals that recur throughout a time series and identifying these patterns plays an important role in time series analysis.
- Event Impact Analysis: Often in time series data there are events that skew the data in a certain direction, so identifying these events and analyzing their impact is another valuable tool for anomaly detection and forecasting.
Time Series Monitoring
Since time series data tracks changes over time it is often used to monitor things like website traffic, fluctuating prices and IT systems. This time series data is often collected in short intervals (i.e., minutes), so as you can imagine the data accumulates very rapidly. As a result, it’s important to have a database that is optimized for time series data, which as we’ll discuss below, is why they’ve grown so much in popularity in recent years.
Time Series Databases
One of the most common applications of time series metrics are time series databases (TSDBs). As you can see from the image below, time series databases are in fact the fastest-growing category of database model in the past 24 months:
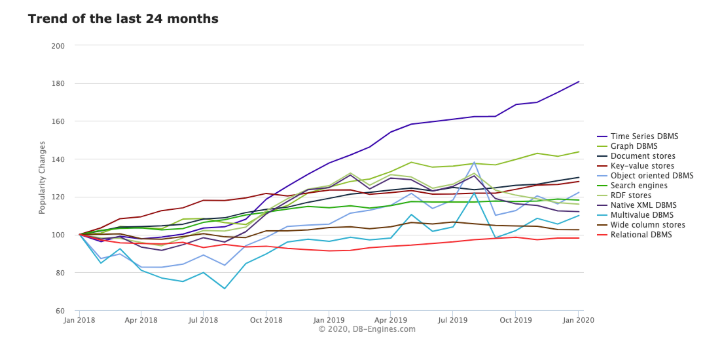
One of the reasons for this trend is that time series databases are much more scalable than normal databases. While you can use a normal relational or NoSQL database, they simply do not perform as well as one that treats time as the primary axis. In particular, a few of the efficiencies of a time series database over normal databases include higher data ingest rates, improved data compression, and faster queries.
Summary: Time Series Metrics
Time series metrics play an incredibly important part of our daily lives. By treating time as the primary axis, we’ve seen that we can use these metrics for statistical analysis, forecasting, monitoring systems, and databases.