
Anomaly detection in time series data has become a cornerstone for monitoring business metrics, IT systems, and security events. Modern machine learning (ML) and AI techniques can automatically learn “normal” patterns and flag unusual deviations, helping organizations catch issues early. In this article, we compare the top 8 tools that offer automated or semi-automated anomaly detection and root cause analysis, ranked by their AutoML capabilities, ease of setup, integration breadth, and user-friendliness. We’ll highlight each tool’s primary use cases, ideal users, supported data integrations, setup complexity, and features for root cause analysis or event correlation.
Why Automated Anomaly Detection?
Traditional threshold-based monitoring often fails in dynamic environments – what’s “normal” can change with seasonality, trends, shifting loads and during periods of special events. AI-driven anomaly detection addresses this by continuously learning from data to create baseline behavior models (Anomaly detection powered by AI). These tools reduce alert fatigue (fewer false alarms) and detect subtle issues (“unknown unknowns”) that static rules miss. Many also correlate multiple signals to identify the root cause of an anomaly, saving valuable time in diagnosis (Automated root cause analysis with Watchdog RCA | Datadog).
Comparison Criteria: In ranking these tools, we focused on:
- AutoML and Automation: Does the tool automatically model normal behavior and tune anomaly detection, or require manual model building? How deep is the automation (e.g. automatic thresholding, algorithm selection, seasonality detection, event handling, multi-scale, etc.)?
- Ease of Setup & Use: How quickly can you get value (plug-and-play vs. lengthy configuration)? Can non-data-scientists (business users, ops teams) use it easily via UI or does it require coding/ML expertise?
- Integration Breadth: Types of data sources supported out-of-the-box – can it ingest data from various databases, SaaS apps, monitoring systems, cloud services, etc., to monitor anomalies across the enterprise?
- Root Cause Analysis (RCA) & Correlation: Beyond just flagging anomalies, does it provide context – e.g., correlating related anomalies, identifying contributing factors or downstream impacts, and pointing to probable causes?
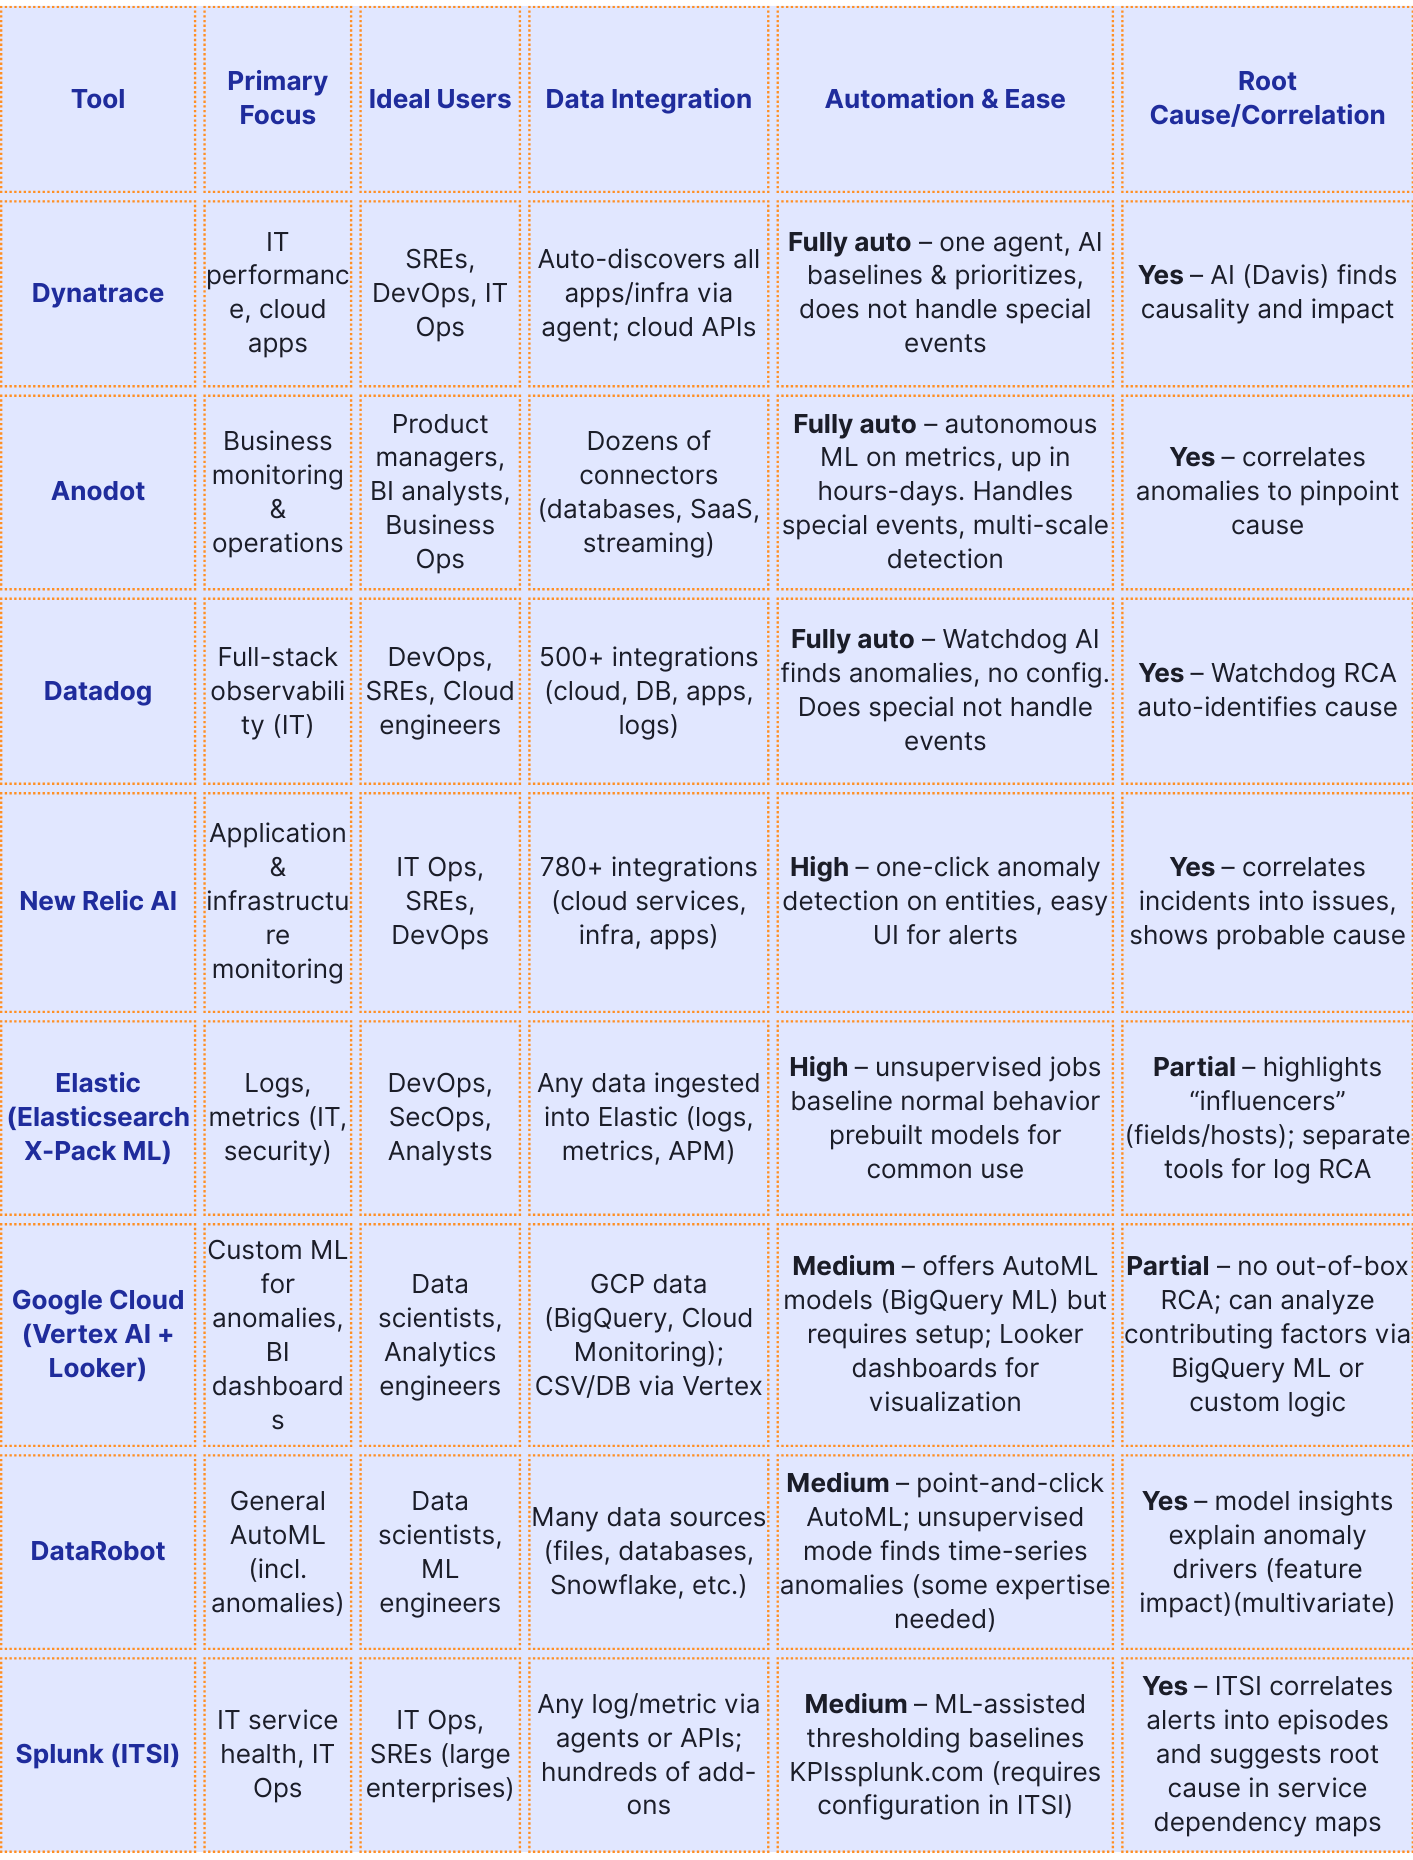
Table: Overview of top anomaly detection tools, their focus areas, and capabilities. (RCA = Root Cause Analysis)
Below we dive into each tool with more details:
1. Dynatrace – Autonomous Cloud Monitoring with “Davis” AI
Dynatrace is a software intelligence platform focused on application performance monitoring (APM) and infrastructure observability. It stands out for its Davis® AI engine, which automatically baselines every metric in dynamic cloud environments and flags anomalies with context. Dynatrace is ideal for SREs and DevOps teams needing hands-off monitoring of complex microservices, container clusters, and multicloud deployments.
- Primary use cases: Digital experience monitoring, cloud infrastructure performance, application latency/error monitoring. Dynatrace watches everything from end-user transactions to backend services for anomalies in metrics like response time, error rate, throughput, etc.
- Ideal users: SREs and IT Ops teams in enterprises running large-scale apps. Also useful to product owners concerned with customer experience, since it links technical issues to user impact. Business executives benefit indirectly from reduced outages.
- Integrations: Dynatrace uses a single agent that auto-discovers hosts, processes, services, and dependencies across the stack. It natively integrates with AWS, Azure, GCP, Kubernetes, and many third-party components. This broad coverage means little manual instrumentation – metrics, traces, and logs stream in automatically.
- Ease of setup (AutoML maturity): Very high. Deploying the agent yields immediate insights. No manual threshold tuning is needed – Dynatrace’s AI autogenerates baselines for normal behavior and continuously adjusts them. It intelligently knows what “normal” is even as containers scale up and down in a microservices environment (Anomaly detection powered by AI). Teams aren’t writing detection rules; the AI handles it and even prioritizes issues by severity/impact.
- Root cause analysis: Excellent. Dynatrace’s deterministic AI doesn’t just detect an anomaly – it correlates events across the “causal topology” of your system (Root cause analysis — Dynatrace Docs). When a problem is detected, it automatically traces through service dependencies to identify the precise root cause component (e.g. a slow database query or failed microservice) and the chain of events. It connects related anomalies into a single incident to eliminate alert storms, and assesses business impact (e.g. whether an anomaly affects users). This deep, automated RCA capability is a core strength – Davis AI highlights the responsible entity and even classifies the severity. As a result, technical teams can fix issues faster, and non-technical stakeholders get fewer but more meaningful alerts.
Dynatrace’s deterministic AI approach means it uses built-in knowledge of system dependencies (service maps, topology) combined with ML baselining. It is often praised for drastically reducing manual effort: “Dynatrace’s AI autogenerates baseline, detects anomalies, remediates root cause, and sends alerts.” . This makes it a top-ranked choice for automated anomaly detection in modern cloud environments.
2. Anodot – Automated Business Metric Monitoring and RCA
Anodot is a specialized platform for real-time anomaly detection in business and operational metrics. It’s designed to monitor 100% of your data streams (revenues, customer usage, transactions, etc.) and catch incidents that could indicate business issues or revenue leaks. Anodot applies unsupervised ML to each metric and across metrics to find anomalies and their likely causes in real-time (Business Monitoring | Anodot).
- Primary use cases: Business KPI monitoring – e.g. detecting drops in conversion rate, spikes in payment failure, or unusual user behavior. It’s used in fintech for fraud detection, in telecom for network KPI anomalies, in ad-tech for revenue irregularities, and even for cloud cost monitoring. Essentially, any time-series data (financial, web analytics, product usage, IT metrics) can be fed in for anomaly surveillance.
- Ideal users: Business operations teams, product managers, BI analysts and data engineers, who need to know ASAP when a key metric deviates. Anodot provides a UI that business users can navigate (complete with dashboards and plain-language alerts), while data teams handle integration. It’s also useful for SREs monitoring business-level SLAs (e.g. transaction success rates).
- Data integrations: Very broad. Anodot prides itself on “easy integration to any data source in your stack” ( Integrations | Anodot). It offers connectors for common databases, data lakes, message queues, SaaS applications, and streaming data. For example, it can ingest from Kafka, AWS S3, REST APIs, SQL databases, or SaaS like Salesforce. This breadth means you can consolidate many metrics (marketing, sales, IT) into Anodot for unified anomaly monitoring.
- Ease of setup (AutoML maturity): Very high. Anodot is a fully autonomous monitoring system – you don’t configure anomaly detection models manually. Once data streams are connected, Anodot’s AI automatically learns each metric’s normal patterns (accounting for seasonality, trends, holidays) and starts alerting on outliers. It boasts “fastest time to value – up and running in hours to days, not months”. Users do not need ML expertise; the system adapts itself (and even allows feedback on alerts to improve relevance). The platform’s completely autonomous learning and correlation means minimal tuning.
- Root cause analysis: Excellent. Anodot doesn’t just raise isolated alerts – it performs correlation analysis across thousands of metrics to pinpoint what else changed at the time of an anomaly ( RCA | Anodot). For example, if revenue dipped because a specific payment gateway failed, Anodot can correlate the revenue metric anomaly with an anomaly in the “payment success rate” metric for that gateway, helping identify the cause. In Anodot’s interface, alerts come with a “root cause” context called “Triage” analysis. According to the company, it “detects anomalies and business incidents in real-time and identifies their root cause”. This often involves drilling down into metric dimensions (e.g. country, product) to find which segment is contributing to the anomaly. The result: actionable alerts that tell you what happened, where and why, enabling quick remedy.
Anodot is known for its rich alerting (email, Slack, etc.) with explanations, and its focus on business impact. It’s truly unsupervised – users don’t need to set thresholds. If you want an AutoML anomaly solution for revenue, customer and business operations with minimal babysitting, Anodot is the top choice. As one case study notes, it helped a company catch issues “an hour or two before customer impact” by monitoring many KPIs automatically.
3. Datadog – Unified Monitoring with Watchdog AI and RCA
Datadog is a popular cloud monitoring and observability platform that covers infrastructure, application performance, logs, and more. Its anomaly detection is powered by the Datadog Watchdog AI engine, which continuously analyzes metric, trace, and log streams. Datadog provides both automated anomaly alerts (via Watchdog) and user-defined anomaly monitors (using statistical models) – blending automation with control. It’s ideal for DevOps teams who already use Datadog for monitoring and want built-in AI insights.
- Primary use cases: Full-stack monitoring and AIOps. Datadog is used to watch cloud infrastructure (CPU, memory, network), microservice performance, container orchestration metrics, and even log patterns – all within one platform. Anomaly detection use cases include spotting sudden latency increases, error rate spikes, traffic drops, or unusual log event patterns. Datadog’s anomaly tools apply across these domains for proactive incident detection.
- Ideal users: DevOps, Cloud Engineers, SREs, and IT Ops in organizations of all sizes. Since Datadog has a wide user base in tech companies for monitoring, those same users benefit from anomaly detection without needing a separate tool. Business analysts could consume Datadog alerts if configured, but the platform is primarily tuned for technical users. It’s also useful for SecOps when using Datadog’s log anomaly detection for security events.
- Data integrations: Extensive – one of the best. Datadog has 500+ built-in integrations for data sources. These include cloud services (AWS, Azure, GCP), databases (MySQL, PostgreSQL, etc.), web servers, messaging systems, SaaS apps, and more. The Datadog agent collects host and container metrics, and there are libraries to send custom metrics. Essentially, any metric or log from virtually any system can be funnelled into Datadog, providing a unified dataset for anomaly analysis. This breadth is a big advantage – anomalies can be correlated across layers (e.g. link an app issue with a host-level anomaly).
- Ease of setup (AutoML maturity): High. If you’re using Datadog, turning on anomaly detection requires little effort. Watchdog operates out-of-the-box. It automatically learns your environment’s baseline behavior. Additionally, Datadog offers an “anomaly()” query function and outlier detection that users can add to any dashboard or alert with a few clicks. The overall approach is “hands-free” for the default AI: Watchdog will surface a feed of possible problems it finds, complete with graphs and context, even if you didn’t set up any alert for them. This makes it easy for both engineers (who get suggestions) and less-technical stakeholders (who can see plain-language explanations in alerts).
- Root cause analysis: Strong. In 2022, Datadog expanded Watchdog with Root Cause Analysis (RCA) capabilities. Now, when an anomaly is detected, Watchdog maps out the relationships between services, metrics, and components in your system to find what likely triggered the issue (Automated root cause analysis with Watchdog RCA | Datadog). For example, if service A’s latency spiked due to a database slowdown on host X, Watchdog will identify the database or host anomaly as the probable root cause. It can even spot a “critical failure” that resulted (e.g. user-facing errors) and link it back to the root cause. This is done automatically by analyzing dependency graphs and time correlations – “Watchdog…automatically identifies causal relationships between symptoms…and pinpoints the root cause.” In practice, Watchdog might say: “Deployment ABC at 10:32am caused service latency to increase – leading to error rate anomaly.” It also provides supporting evidence (like showing the specific error or a flame graph trace). These features significantly cut down troubleshooting time. Additionally, Datadog can group related anomalies: for instance, if multiple metrics go awry from one event, it will raise one composite story in the Watchdog feed.
Datadog’s strength is combining vast observability data with smart anomaly detection and RCA in one pane. It’s friendly to existing users – if your team is already in Datadog, the AI insights come with minimal extra effort. Note that Datadog’s focus is more on technical anomalies.
4. New Relic Applied Intelligence – Anomaly Detection for Full-Stack Telemetry
New Relic is a longtime APM and observability provider, and its Applied Intelligence (AI) suite brings AI/ML capabilities (anomaly detection, alert correlation, etc.) into its platform New Relic One. New Relic’s anomaly detection can be enabled on virtually any monitored metric or entity with a few clicks (Next Gen AIOps: Expanded Anomaly Detection, Issue Maps, and More | New Relic). It’s paired with features like Lookout (to explore large numbers of metrics for issues) and Issue Maps (to correlate incidents). This makes New Relic a strong AIOps contender for those already using its monitoring platform.
- Primary use cases: Monitoring and detecting anomalies in applications, infrastructure, and digital experience. For example, New Relic can automatically baseline the “golden signals” (latency, traffic, errors, saturation) of your applications and alert on anomalies. It’s also used for cloud infrastructure metrics anomalies (CPU, memory, etc.) and even custom business metrics that users send to New Relic’s Telemetry Data Platform. Essentially, any telemetry data ingested can have anomaly detection applied – this spans APM, infrastructure, browser/mobile performance, and more. Another use case is incident management: using AI to reduce the noise of many alerts and highlight the critical ones.
- Ideal users: IT Operations teams, SREs, and DevOps who rely on New Relic for observability. Since the anomaly detection is integrated, it’s best for those already forwarding their metrics to New Relic. Business stakeholders can benefit by receiving fewer, smarter alerts (e.g. “checkout transactions are abnormally slow”) instead of raw threshold breaches. New Relic’s UI is accessible enough that even less-technical users (like product managers or support leads) could explore anomaly dashboards like Lookout, although primary configuration is done by technical staff.
- Data sources and integrations: Extremely broad. New Relic has 780+ integrations for gathering telemetry – from AWS/Azure/GCP services to on-prem servers, Kubernetes, databases, and SaaS apps. Through its agents and APIs, it can ingest logs, metrics, traces from virtually anywhere (similar to Datadog). If something is not out-of-the-box, users can send custom data via the Telemetry SDK or OpenTelemetry. New Relic is essentially a centralized data platform, so anomaly detection can run on any data you put in: whether it’s an Nginx request rate or a custom revenue metric. This broad integration means anomalies can be detected in a unified way across your whole stack.
- Ease of setup (AutoML maturity): High. New Relic has significantly improved ease in recent years. As per their 2021 announcement, “You can now detect anomalies on nearly any entity in New Relic with just a few clicks”. Users can go into New Relic One’s interface (Alerts & AI section) and enable anomaly detection for specific entities or metrics; the system will then start learning their normal range. This expanded anomaly detection no longer limits to APM metrics – it includes infrastructure, custom metrics, etc., via New Relic Lookout and Workloads . No manual threshold setting is needed; it’s adaptive. There is a sensitivity slider if needed to tune how reactive it is, but otherwise it’s automated. New Relic also provides a feature called Lookout that automatically highlights any abnormal metric behavior across all your systems in a visual heatmap, which is great for exploratory use without configuration. Overall, you don’t have to be a data scientist – it’s mostly a UI-driven setup appropriate for ops generalists. The AutoML behind the scenes does the heavy lifting of baseline modeling.
- Root cause analysis and correlation: Strong, especially with recent features. New Relic Applied Intelligence not only detects anomalies, it also tries to reduce the noise and point you to the root cause through features like Issue Maps and Incident Analysis. When multiple alerts or anomalies occur, New Relic’s AI will correlate related incidents into a single “issue” and provide an issue summary with context and probable root cause. For example, if a server high CPU alert and an application slowdown alert happen together, it might group them into one issue. The Issue map visualization shows the relationships between affected entities (services, hosts, etc.), so you can see at a glance which component might be causing a domino effect . New Relic will highlight an entity that is likely the root cause (say, a database) and show upstream/downstream dependencies impacted. It also provides Incident analysis with details like implicated error logs, stack traces, or slow queries for deeper root cause evidence. In essence, New Relic’s AI is doing a lot of what an on-call engineer would do: collating signals and hinting at where to start looking. This dramatically helps mixed teams – a level 1 support engineer or on-call dev can get “probable root cause” surfaced automatically. While perhaps not as fully autonomous as Dynatrace’s Davis (which does root cause with zero human config using its model of the entire system), New Relic’s approach is highly valuable in noisy, complex environments by reducing alert fatigue and speeding up MTTR.
In conclusion, New Relic’s anomaly detection and AI ops capabilities have matured to make it a strong choice for organizations already leveraging New Relic for monitoring. It brings a lot of automation to incident detection and analysis, while still allowing users control and visibility. The ease of enabling it and the context it adds (correlating and suggesting root causes) lands New Relic in the top half of our list, especially for those who prefer an integrated solution in their existing monitoring toolkit.
5. Elastic (Elasticsearch X-Pack ML) – Anomaly Detection for Logs and Metrics
Elastic, known for the ELK Stack (Elasticsearch, Logstash, Kibana), offers built-in Machine Learning features (part of X-Pack/Platinum features) that perform anomaly detection on time-series data. This is often used in Elastic’s solutions for observability and security. Elastic’s approach automatically models normal behavior for a given metric or log rate and flags anomalies, with the ability to indicate which entities (hosts, users, etc.) are involved. It’s a powerful add-on for those who already use Elastic to store and analyze data.
- Primary use cases: IT operations monitoring and security analytics. In IT Ops, Elastic ML jobs are used to watch metrics like CPU usage per host, transaction response times, log event rates, etc., and detect anomalies (e.g., sudden error rate increase on a service). In APM, it can find unusual latency spikes. In logging, it can detect an unusual surge of certain log messages (indicating, say, a failure loop or cyberattack). Security teams use Elastic ML in SIEM to spot anomalies like a rare process execution or data exfiltration patterns. Additionally, it’s used in industrial IoT (monitor sensor data for equipment anomalies). Essentially, any time-series data indexed in Elasticsearch can have an ML “job” to analyze its pattern.
- Ideal users: DevOps/SRE teams and SecOps analysts who are already using the Elastic Stack. Elastic’s anomaly detection isn’t a turnkey SaaS for business folk; it’s typically operated by engineers or analysts through Kibana. Those with large volumes of data (logs/metrics) and a need for custom analytics like anomaly detection benefit. Data scientists can also leverage it as a quick way to apply unsupervised ML to data without coding.
- Data integrations: Wide (via Elastic data ingest). Elastic can ingest data from virtually anywhere using Beats (lightweight data shippers), Logstash pipelines, or integrations. This includes system metrics, application metrics (e.g., via OpenTelemetry exporters), logs from applications, network data, etc. If your data is in Elasticsearch indices with a timestamp field, you can run anomaly detection on it. Out-of-the-box, Elastic comes with predefined ML jobs for common integrations – for example, detecting anomalies in AWS CloudWatch metrics, or in Cisco firewall logs, etc., which align with its solution packs. So while Elastic doesn’t “integrate to SaaS X and Y” in the way Anodot do, it integrates at the data level – once data (from any source) is in, it’s fair game.
- Ease of setup (AutoML maturity): Moderate to High. Setting up anomaly detection in Elastic usually involves creating an “ML job” in Kibana. You choose the index and fields to analyze, and select a function (e.g., mean of a metric, count of events) and an interval. Elastic provides wizards and even some one-click jobs for common data sets, so you don’t need to script algorithms – it’s automated once configured. The ML job will automatically create a baseline model from historical data and start “continuously modeling the normal behavior of your time series data – learning trends, periodicity, and more – in real time to identify anomalies”. This means minimal manual tuning; Elastic ML adapts as more data comes. However, compared to something like other services, there’s a slightly higher learning curve in understanding how to configure jobs (bucket span, influencers, etc.). Elastic does not require you to label data or pick specific algorithms – it uses proprietary unsupervised algorithms (like advanced forecasting or clustering under the hood). So in that sense it is AutoML – it “automates analysis of time series data by creating accurate baselines of normal behavior” (Finding anomalies | Elastic Docs). You just might need an Elastic power-user to set up the job definitions initially. Once running, results are visible in Kibana Anomaly Explorer with nice charts.
- Root cause analysis features: Partial (influencers and correlations). Elastic’s anomaly detection jobs can be configured with “influencer” fields – these are dimensions (like hostname, user, IP, etc.) that the model will analyze for their contribution to anomalies (Influencers | Machine Learning in the Elastic Stack [7.17]). When an anomaly is detected, Elastic will list which influencer values were most unusual. For example, it might say “response time anomaly mainly on host = web-server-3.” This helps pinpoint the root cause domain (it tells you what is associated with the anomaly) but doesn’t always say why it happened. In Elastic Observability, there are other features like Log Categorization and Correlation that can assist – e.g., if a spike in errors is detected, you can use the “Logs correlation” tool to find which error message spiked, giving a clue to the root cause. Elastic also provides pre-configured detection rules and case management in its SIEM and APM that, combined with ML anomalies, guide analysts to potential causes (for instance, correlating a rare process execution anomaly with an alert about a malware signature). Still, compared to Dynatrace or New Relic, Elastic is more of a toolkit – it surfaces anomalies and relevant fields, but the human analyst often does the final correlation. One notable capability: Elastic can forecast the data and see if an anomaly is expected to continue, and it can group anomalies (multi-metric jobs) to reduce noise.
In summary, Elastic’s anomaly detection is a mature feature for those invested in the Elastic Stack. It offers a lot of flexibility (multivariate analysis, custom detectors) and is proven in both IT and security domains. It might require more user input than some others (hence a bit lower ranking), but rewards you with a powerful unified data analysis platform. The ability to see anomalies in the same dashboards as your log data and then pivot to related info is a big plus for investigative workflows – “Elastic’s machine learning will…provide anomaly detection and pinpoint potential root causes through time series analysis and log outlier detection.” (Root cause analysis with logs: Elastic Observability’s anomaly detection and log categorization — Elastic Observability Labs) It’s a key part of bringing AI to the traditionally manual Kibana analysis.
6. Google Cloud (Vertex AI + Looker) – Custom Anomaly Models with Google’s AI Suite
Google Cloud doesn’t have a single off-the-shelf anomaly product, but it offers a stack to build your own anomaly detection solution using Vertex AI (formerly AI Platform), BigQuery ML, and Looker for visualization. This entry represents leveraging Google’s cloud ML tools and BI platform together to achieve automated anomaly detection. It’s a more custom approach, but one that can be very flexible.
- Primary use cases: Custom ML anomaly detection in scenarios where you might have unique requirements or want to integrate with Google’s data ecosystem. For example, detecting anomalies in manufacturing sensor data using a custom AI model, or monitoring retail metrics by training a forecasting model and seeing where actuals deviate. It’s used in finance (fraud detection), data quality monitoring (finding anomalies in data pipelines), and classic IT/biz metrics if one prefers to script it. Google Cloud customers often use BigQuery ML’s anomaly detection on large datasets to find outliers in, say, daily revenue per store across thousands of stores. With Looker (Google’s BI tool), these anomalies can be surfaced in dashboards or alerts to business users.
- Ideal users: This approach is best for data scientists, ML engineers, or analytics engineers who are comfortable building models or SQL in BigQuery. It’s also suitable for data-driven enterprises that want more control over the modeling. Business users are the end consumers (via Looker dashboards or alerts that the technical team sets up), rather than the ones configuring the anomaly detection. In short, if you have a data team that can leverage Google’s ML, they can deliver anomaly insights to both technical and non-technical stakeholders.
- Data integration: Centered on Google’s cloud data services. BigQuery is a common data hub – if your time series data is in BigQuery, using BigQuery ML to detect anomalies is straightforward. Google Cloud can ingest data via Pub/Sub, Dataflow, etc., into BigQuery or Cloud Storage. There’s also Cloud Monitoring (Stackdriver) which provides basic anomaly detection on metrics from GCP services and custom metrics (with features like forecasting-based alerts). And if using Looker, it can directly query various databases (not just BigQuery) to get data. In practice, many will store metrics in BigQuery (or Cloud Bigtable for time series) and use Vertex AI or BQML to analyze them. Integration with Google Analytics, Google Ads data etc., is also possible through BigQuery data transfers. So while not a single turnkey integration list, the platform can hook into many sources via Google’s data integration offerings.
- Ease of setup (AutoML maturity): Medium. Google Cloud provides the building blocks, but you must assemble them. For example, with BigQuery ML, you can now do unsupervised anomaly detection by simply writing SQL: “SELECT … FROM ML.DETECT_ANOMALIES(MODEL my_model, TABLE my_data)”. BigQuery ML supports models like ARIMA_PLUS (time series forecasting with anomaly detection) and PCA or K-means for outlier detection (What’s new with BigQuery ML: Unsupervised anomaly detection for time series and non-time series data | Google Cloud Blog). This is relatively easy if you know SQL and understand your data. It’s “AutoML” in the sense that Google will handle the modeling behind the scenes (e.g., fitting an ARIMA model and using its prediction intervals to flag anomalies (Exciting Preview: Multivariate Time Series Forecasting for Anomaly …)). Google’s Vertex AI also offers an AutoML Forecasting service, which could be used to predict values and identify anomalies when reality diverges. However, using Vertex AI or custom notebooks means more ML expertise and effort (training models, etc.). Looker can be set up to use these models – for instance, one FinOps presentation showed how anomalies detected via BigQuery ML were presented in Looker dashboards for easy consumption (Anomaly Detection with Looker on Google Cloud – YouTube). Setting that up is not as simple as toggling a feature in a SaaS app; it’s a mini project. Thus, for pure plug-and-play anomaly detection, Google’s approach is less straightforward. On the plus side, if you already have data in Google Cloud, leveraging BQML’s anomaly detection might be just a few queries away, and it’s scalable to massive data. In summary, Google gives you the flexibility to customize (choose algorithms, multivariate vs univariate, etc.), but with that comes some assembly – so we rate ease/setup as medium.
- Root cause analysis: Custom/None out-of-box. Since you’re building the solution, RCA capabilities depend on what you implement. Google Cloud doesn’t provide a pre-baked RCA engine for anomalies like the other tools do. Root cause is manual process – using Google’s analytics tools: for example, if BigQuery ML flags an anomaly, you could use Looker’s exploration to slice that metric by various dimensions to find which segment is contributing (a manual but guided analysis). If you have the anomaly info stored (say anomalies in a BigQuery table), you could also cross-correlate with other data using SQL joins (e.g., join anomaly timestamps with a table of deployments or incidents to see if any known event aligns). Moreover, Google’s AI platform allows you to build sophisticated models – one could train a multivariate model or even use Vertex AI Explainable AI features to see which features influenced an anomaly classification (if you framed it as a supervised problem with synthetic anomalies, for instance). These are advanced approaches. In short, out of the box there isn’t a push-button “root cause” for anomalies on GCP; you’d typically rely on the flexibility of the data platform to do ad-hoc analysis or incorporate tools like Looker’s data alert explanations. Google’s strength is providing the raw power to analyze big data for anomalies (e.g. detecting anomalies across hundreds of metrics using SQL or AI), which you can integrate into custom workflows.
To sum up, a Google Cloud-based approach to anomaly detection is best for organizations that have complex or large-scale data and want tailor-made solutions. It may not be as immediately user-friendly as dedicated anomaly SaaS products, but it offers unmatched integration with your data warehouse and ML ops. A practical example: you could have a scheduled BigQuery ML job that scans for anomalies in your metrics each hour, writes the results to a table, and then Looker triggers an alert email if any anomalies are found – all on Google’s infrastructure. This approach is powerful but requires engineering effort. We include it in the top 8 to represent those use cases where customization and integration with a broader data strategy are more important than turnkey simplicity.
7. DataRobot – Enterprise AutoML Platform (with Anomaly Detection Capabilities)
DataRobot is an enterprise AutoML platform that can automate the building and deployment of machine learning models. While much of DataRobot’s popularity comes from supervised learning (predictions, classifications), it also supports unsupervised time series anomaly detection projects (Anomaly detection: DataRobot docs). With DataRobot, users can train models to detect anomalies in their data without writing code, leveraging a library of algorithms and its modeling engine. It’s well-suited for organizations that want to integrate anomaly detection into a broader AI pipeline or need more control over the modeling process than a black-box service.
- Primary use cases: Custom anomaly detection in various industries – often where anomaly detection is one part of a larger analytics initiative. For example, in manufacturing for predictive maintenance (detecting equipment behavior anomalies that precede failures), in financial services for identifying unusual transactions, or in IT for detecting anomalous system metrics. DataRobot allows multivariate anomaly detection (multiple features) or time-series based anomalies (across time). A common use case is feeding in a rich dataset of time-stamped metrics and letting DataRobot find anomalies across many correlated signals (e.g., IoT sensor arrays). Another is data quality anomaly detection – detecting outlier data entries. Essentially, any scenario where you have historical data and want to build an unsupervised model to flag out-of-norm events could leverage DataRobot.
- Ideal users: Data scientists, data analysts, and AI engineers in enterprise settings. DataRobot is a powerful platform, but it’s also complex – typically a company’s data science team will use DataRobot to create models, and then business users might consume results via an app or report. It’s not as directly business-user-facing as Anodot. DataRobot’s UI is code-optional, so analysts with some ML knowledge can use it. It’s often chosen by organizations that want to standardize and accelerate their machine learning development, including anomaly detection models, without manually coding in Python/R for every project.
- Data integration: Many connectors and APIs. DataRobot can import data from flat files, databases, Hadoop, cloud storage (S3, etc.), or via integrations with Snowflake, Spark, etc. It’s generally an offline modeling approach – you bring in historical data to train models. For real-time detection, DataRobot models can be deployed via an API to score new data on the fly. As such, it can integrate into production systems through its prediction API or via integration with BI tools. In practice, DataRobot might be fed by your data warehouse or data lake. While not as trivial as a point-and-click SaaS connector, DataRobot’s integration ecosystem is quite broad for enterprise data sources.
- Ease of setup (AutoML maturity): Medium. DataRobot is all about automation in the modeling process. For anomaly detection, you create a project, load data, and select an unsupervised modeling option (like “anomaly detection” with time awareness). DataRobot will then try a variety of algorithms (isolation forests, clustering, etc.) to produce a model that best fits the data, ranking them by an internal metric (e.g., Synthetic AUC for anomalies). It effectively handles feature engineering and algorithm selection automatically. For time-series anomaly detection, DataRobot makes it as easy as not specifying a target variable and letting it run unsupervised on the time series. It even handles things like seasonality detection and can do “point anomaly” or “sequence anomaly” detection by adjusting feature settings . This is AutoML in the sense that a lot of data science grunt work is automated. However, the user still needs to understand their data and follow the workflow: upload data, maybe partition it, interpret the model results. Also, DataRobot is a heavy platform to deploy (though they have cloud-hosted versions). It’s not a few clicks like some SaaS – it’s more an afternoon of setting up a project, then iterating. On the plus side, you don’t have to code any algorithms yourself. On the down side, tuning the process (e.g., choosing the percentage of expected outliers, adjusting the feature derivation window in time series) may require some expertise. So it’s best for organizations that have the resources to operate an AutoML platform and want control and insight into the modeling.
- Root cause analysis: Exploratory (model-driven insights). DataRobot provides some tools to explain anomalies. For instance, it can give “Anomaly Score Explanations” or feature impact for why certain points were flagged. This means if an anomalous data point is identified, DataRobot might tell you which features (variables) contributed most to it being weird. It basically uses techniques like Shapley values or distances in cluster space to highlight what’s unusual about that point. This is useful in multivariate settings – e.g., an anomalous server instance might be characterized by high memory usage and network I/O, pointing you toward those factors. DataRobot also allows partial labeling – if you have some known anomalies, you can incorporate that to improve and validate the model. By doing so, you could get a semi-supervised model that is better at explaining known failure modes. All that said, DataRobot’s output is a model and a list of anomaly scores; it doesn’t automatically correlate across different metrics in production like an observability tool would. You would use its model output in your context. For example, if DataRobot flags a particular machine as anomalous, you would then investigate that machine with other tools. DataRobot won’t automatically say “the root cause is a faulty sensor” – but its feature insights might hint at the sensor reading that’s off. The platform is also integrating more with MLOps, so one could trigger actions when anomalies are predicted (but that’s something the user sets up, e.g., an alert or a function call).
In summary, DataRobot is a top choice when you want anomaly detection as part of a broader AI strategy and need the ability to fine-tune, customize, and integrate with enterprise systems. It’s likely overkill for simple anomaly monitoring needs, but extremely valuable when anomaly detection is complex (multivariate, high-dimensional, requiring domain-specific modeling) and you want to leverage automated ML to tackle it. DataRobot essentially gives you the means to build an in-house anomaly detection solution with less manual coding.
8. Splunk (ITSI & MLTK) – Anomaly Detection in IT Service Intelligence
Splunk is a well-known platform for log and event analysis, and it offers anomaly detection capabilities primarily through Splunk IT Service Intelligence (ITSI) and the Splunk Machine Learning Toolkit (MLTK). Splunk ITSI is a premium app that provides monitoring of key performance indicators (KPIs) with advanced features like adaptive thresholding and event correlation. While Splunk’s core use is often reactive search, ITSI turns it proactive by using ML to baseline metrics and detect anomalies. Splunk earns a spot in this list for its widespread use in enterprises and its evolving AIOps features.
- Primary use cases: IT operations monitoring and alerting for complex systems, especially where Splunk is already aggregating logs and metrics. ITSI is used to monitor service health scores computed from multiple KPIs, and it uses anomaly detection to flag when those KPIs behave abnormally. For example, monitoring the throughput and error rate of a payment service – ITSI can learn their typical range and alert if errors spike unusually. Another use is infrastructure metric anomalies (if you feed in CPU, memory metrics to Splunk, it can detect odd spikes). In addition, security operations can use Splunk’s ML to detect anomalies in log data (though Splunk also has a separate User Behavior Analytics product for security anomalies). Overall, Splunk’s anomaly detection is geared towards finding issues in real time within the massive streams of operational data that Splunk collects.
- Ideal users: IT operations teams in enterprises, NOC/SOC analysts. Companies that already use Splunk for logging and monitoring are the target, as they can leverage anomaly features on their existing data. Splunk ITSI is often used by service owners and IT managers who want a higher-level view of service health. It’s less likely a business user (outside of IT) would directly use Splunk to spot a revenue anomaly, for example – that’s not Splunk’s sweet spot. Technical users who know Splunk (creating dashboards, KPIs, etc.) set up the anomaly detection. Splunk’s interfaces (like ITSI Glass Tables, etc.) can be shared with management to visualize anomalies and impacted services in a user-friendly way.
- Data sources: Virtually any data that Splunk can ingest (logs, metrics). Splunk has a Metrics store for numerical time series and of course can index logs with timestamps. It can ingest from agents (forwarders), SNMP, APIs, etc. – a huge variety of integrations, especially via the Splunkbase apps (for example, there are apps to pull data from AWS CloudWatch, or VMware, etc.). If an organization has instrumented their systems to send data to Splunk, those data points can be used for anomaly detection. Splunk ITSI specifically works with defined KPIs, which could be derived from any Splunk search (so any data in Splunk is fair game to become a KPI). Splunk’s flexibility is high, but it requires the data to be there and perhaps some transformation SPL (Splunk Processing Language) to define what metric to monitor.
- Ease of setup (AutoML maturity): Moderate. Splunk’s anomaly detection isn’t as one-click as some others; it often requires configuration. In ITSI, you define KPIs (queries) and then you can enable Adaptive Thresholds for them. The adaptive thresholding uses ML to automatically set dynamic thresholds based on historical data (Webinar: Adaptive Thresholds and Anomaly Detection: Unleash the Power of Machine Learning for Improved Operations with Splunk ITSI | Splunk). Essentially, Splunk “employs machine learning to baseline normal operations, identify anomalies and adapt thresholds dynamically.” This relieves you from manually setting static alert levels. It can detect gradually changing patterns and adjust. However, to get there, a Splunk admin must set up the ITSI service entities and KPIs. It’s not difficult for someone versed in Splunk, but it’s not fully automatic on its own (unlike Datadog Watchdog, which you just turn on). Splunk MLTK offers another route: it has assistants and SPL commands (like anomalydetection search command) that savvy users can apply on data to find anomalies. That requires more manual work and understanding of the data science, but gives flexibility (you could run a one-time anomaly search over, say, web access logs to find outliers). Splunk has been adding easier experiences, such as a “Trending and Entity Cohesion” anomaly detection for KPIs that can be applied with a click (Apply anomaly detection to a KPI in ITSI – Splunk Documentation). Still, the ecosystem feels more “some assembly required” compared to plug-and-play SaaS. Splunk ITSI’s power is huge once configured, but smaller orgs might find it heavy. Because of this and Splunk’s licensing cost, some users turn it on for the most critical metrics only. In summary, Splunk gets a medium ease score: great capabilities, but you need to know what you’re doing to leverage them fully.
- Root cause analysis: Yes, via event correlation (Episodes) and service context. Splunk ITSI includes an “Event Analytics” framework that correlates related alerts into Episodes (similar to New Relic’s issue grouping). It looks at things like common hosts, common services impacted, or time proximity to group alerts. ITSI also provides a feature called Episode Review where it can apply predefined or custom correlation rules to do noise reduction. While not as inherently ML-driven as Dynatrace’s causation engine, it significantly helps identify when multiple anomalies are part of one incident. Splunk also has topology frameworks (you can define service dependencies in ITSI), so if one service’s KPI anomaly often precedes others, that can be built into the analysis. Additionally, the Entity Cohesion algorithm (part of ITSI anomaly detection) can detect if one entity (e.g., a host) is behaving differently from its peers, which is a hint that something is wrong on that host – a kind of root cause isolation by peer comparison. Splunk’s Machine Learning Toolkit could be used to do custom root cause analysis as well – for example, train a model to predict one metric from others and see which deviation is cause vs effect. But out-of-the-box, the main root cause aid is the ITSI glass table and service dependency views combined with correlated episodes, which help operators visually drill into where the problem lies. In Splunk’s own words, ITSI “simplifies operations, prioritize problem resolution and align IT with the business” – it provides context (like which business service is impacted by an anomaly) which is vital for assessing root cause and impact.
Overall, Splunk’s anomaly detection offering is powerful, especially for those already aggregating data in Splunk. It leverages ML to reduce manual threshold setting and to catch issues hidden in mountains of logs and metrics. While not the easiest or cheapest solution, it’s part of a robust platform that many enterprises rely on. Splunk is evolving towards more AIOps capabilities – for instance, integrating its recent acquisitions and features for on-call routing, etc. For organizations with Splunk, using ITSI’s adaptive anomaly detection is a logical next step to modernize their monitoring. It may not be “set and forget” at the level of some specialized tools, but it can be finely tuned to an organization’s environment and paired with Splunk’s unparalleled exploratory analysis for investigating any anomalies that pop up.
Honorable Mentions and Niche Solutions
Beyond the top 10, a few other tools and services deserve mention for anomaly detection, especially in specific domains:
- AWS Lookout for Metrics: Amazon’s fully-managed anomaly detection service (similar in spirit to Azure’s) launched in 2021. It could connect to many AWS data sources (CloudWatch, S3, Redshift, etc.) and automatically detect anomalies in metrics with no ML expertise needed (Transitioning off Amazon Lookout for Metrics | AWS Machine Learning Blog), even attempting to identify root causes by pinpointing which dimensions changed most. However, AWS has announced the end-of-life for Lookout for Metrics – no new signups as of Oct 2024, and support ending by Oct 2025 (Transitioning off Amazon Lookout for Metrics | AWS Machine Learning Blog). AWS recommends using alternative services like Amazon OpenSearch (which has anomaly detection), CloudWatch alarms, or QuickSight (BI dashboards with anomaly detection insights) going forward (Transitioning off Amazon Lookout for Metrics | AWS Machine Learning Blog). Lookout for Metrics is a case study in how big cloud vendors are integrating anomaly detection into broader platforms rather than a standalone service. If you are an AWS user, consider OpenSearch’s anomaly detection (the open-source equivalent of Elastic’s ML), or Amazon QuickSight’s ML Insights which can automatically call out anomalies in BI reports.
- Vectra AI (and other Security-focused Anomaly Tools): Vectra is a leader in Network Detection & Response (NDR) using AI. It specializes in detecting anomalies in network traffic and user behavior indicative of cyberattacks. Vectra’s platform ingests data from network sensors and cloud logs and looks for things like command-and-control communication, lateral movement, or account takeovers using ML (going beyond simple static rules). This is essentially anomaly detection in the security domain – finding malicious anomalies vs. benign outliers. Darktrace is another notable security AI company: it pioneered the “Enterprise Immune System” concept where unsupervised ML learns normal network patterns and flags deviations that could be threats. These tools are used by Security Operations Centers and focus on different data types (packets, flows, authentication logs) with specialized algorithms. We mention them as they are highly sophisticated anomaly detectors, but they are purpose-built for cybersecurity. They won’t rank in a general list because they don’t monitor generic business or IT performance metrics; instead, they excel at identifying threats like insider attacks or malware by their anomalous behavior. If your goal is security anomaly detection, consider these platforms as top options (Darktrace for a more broad self-learning approach, Vectra for focusing on known attacker behaviors blended with anomaly detection). They often include some form of root cause or incident chaining (e.g., Vectra shows an attack progression across hosts).
- Other AIOps and Monitoring Platforms: There are many other tools with anomaly detection features. For instance, IBM Watson AIOps and Moogsoft offer AI-driven incident detection and correlation in enterprise ITSM contexts. Zabbix (open-source monitoring) has some basic anomaly triggers. ScienceLogic and OpsRamp are IT operations platforms that have started integrating anomaly detection to modernize their alerting. Even smaller services like Anomaly.io (not to be confused with the generic term) offer “anomaly detection as a service” that developers can hook into – Anomaly.io, for example, touts “no configuration required” and automatically finds patterns/correlations in metrics you send ( Anomaly Detection and Monitoring Service) ( Anomaly Detection and Monitoring Service). In the data quality space, tools like Monte Carlo and Great Expectations have anomaly detection to flag data pipeline issues.
Each tool has its niche, but the common thread is the industry’s movement towards automated anomaly detection to augment human monitoring. The top 8 we detailed are among the most prominent and feature-rich in 2025 for time-series data, covering a spectrum from IT ops to business analytics. When choosing, consider where your biggest needs lie: are they in developer/ops efficiency, business insight, or security? Also weigh the ecosystem – adopting a tool that fits well with your existing data sources and user skillsets will smooth the path.
Conclusion
Anomaly detection has graduated from a manual, error-prone endeavor to an intelligent, largely automated capability found in modern monitoring and analytics tools. The “best” solution depends on your context:
- For fast, out-of-the-box results on business metrics: Tools like Anodot shine with quick integration and plain-language insights, making them friendly to business users and product managers. They handle the ML behind the scenes and deliver you anomalies that matter, often with root cause pointers, in real time.
- For deep IT infrastructure and application monitoring: Dynatrace, Anodot, Datadog, New Relic, and Elastic (with X-Pack ML) provide integrated AIOps within your observability platform. They are ideal for SREs and IT Ops to catch and resolve issues before users notice. Dynatrace’s deterministic AI is extremely automated (great for large dynamic environments), while Datadog and New Relic blend automation with user control in ecosystems you may already use. Elastic adds anomaly detection power to the beloved flexibility of the ELK stack, which is great if you’re already indexing tons of data there.
- For a DIY, data-science driven approach: Google Cloud’s Vertex AI/Looker combo and DataRobot’s AutoML give you the building blocks to tailor anomaly detection to your needs. These are suited for organizations with strong data teams that want customization or to integrate anomalies into broader predictive systems. They might require more effort up front but can adapt to very specific use cases (like bespoke multivariate models, custom alert logic, etc.).
- For enterprise operations at scale: Traditional players like Splunk offer anomaly detection as part of a larger suite addressing monitoring, alerting, and ticketing. If you have a mature Ops setup funneling through Splunk or Moogsoft, leveraging their anomaly capabilities can be a practical step – you get AI without ripping out existing tools. Just be prepared to invest time in configuration and tuning.
In evaluating anomaly detection tools, keep in mind ease of use vs. flexibility. Fully automated tools minimize the need for data science expertise but might abstract away details you care about. Platforms that allow more tweaking might deliver more tailored results but need closer attention to configure. Also consider integration and data coverage: the tool is only as good as the data it sees. A slightly inferior algorithm with access to all your relevant data will outperform a superior one that’s blind to key streams.
Importantly, anomaly detection is not a silver bullet. It reduces the monitoring burden and catches unseen issues, but it can sometimes surface false positives or miss anomalies during wild data shifts (e.g., holiday season patterns). That’s where domain knowledge and feedback loops remain crucial – look for tools that allow you to give feedback on alerts (mark them as useful or not) which the AI can learn from over time (like Anodot). The best deployments of these tools treat them as “junior analysts” that work 24/7, with humans refining their output.
Finally, the good news is that whether you’re a data leader, engineer, product manager, or exec, the solutions available today can bring you timely, actionable insights from your time-series data – often before you even know where to look. By adopting the right anomaly detection tool, you empower your team to be proactive and data-driven, catching “unknown unknowns” and turning potential surprises into manageable events.