
In any platform of sufficient complexity, multiple anomalies are likely to occur. For many organizations, NOC operators triage multiple anomalies based on their severity. There are internal, non-customer-facing issues that might affect only a small part of your workforce and one-time issues that affect only a small number of customers. Both of the issues get ticketed and sent to low-level support. Meanwhile, systemic issues that affect a large number of users and customers are handled directly by developers.
Any issues that affect a large number of customers – causing dissatisfaction, preventing them from completing orders, or blocking your service entirely – should be treated urgently. We cite this figure often, but when downtime costs $5,600 per minute, seconds matter in the struggle against unplanned outages.
In the rush to solve bigger and more costly outages, developers and engineers will most likely ignore the issues being faced by frontline support, and in most cases, they’re right to do so. In some instances, however, seemingly unrelated issues will be linked to broad outages and studying them will lead to a faster resolution.
It’s nearly impossible for a human observer to say which of these smaller anomalies warns of a broader outage. Only an AI that monitors thousands of metrics at once can say definitively which pairs of anomalies are actually related.
Correlating Anomalies: How Does it Work?
To give you a sense of how valuable it is to correlate anomalies, let’s look at an example from our own archives. Anodot regularly collects about 230 million metrics every week. Out of those, we find 260,000 anomalies. After using correlation, however, only 4,700 grouped anomalies occur. This is a reduction in overall alerts, making it much easier to get to the bottom of each anomaly without being overwhelmed by issues competing for your attention.
Finding correlated anomalies requires scale, speed and accuracy. Only machine learning can correlate anomalies in time to produce useful results.
How do you identify which metrics are related, and which are not?
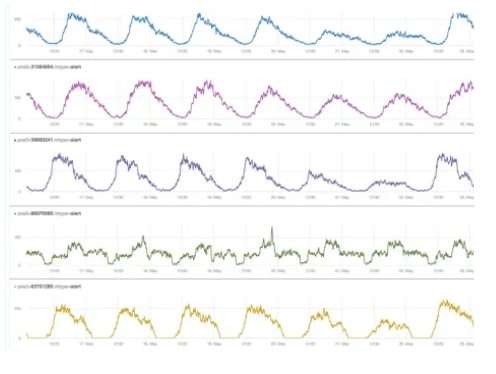
Take a look at the metrics below. As you can see in the green graph, all except one of them look the same. This means that they’re probably related. They have identifiable patterns that people can recognize, but it’s not easy to perform similar feats with machine learning.
For example, many of the methods used to compare time series involve linear correlation. This method is sensitive to seasonality, however, which means that you need to de-season data before processing. Even when seasonality has been removed, however, linear correlations can falsely group unrelated metrics if the two time series happen to be similar for a short amount of time.
Pattern matching is a better solution. Using a dictionary of common patterns within your metrics, an algorithm can apply a pattern-matching solution to identify which metrics are related. You’ll likely have to build your own pattern-matching engine, but this can be done using deep learning.
It’s important to note that this method only finds similarities in metrics while they’re acting normally. Metrics that experience anomalies at the same time might be related, but the best way to be sure is to find multiple instances of synchronized anomalies. We do this by transforming metrics into what’s known as a ‘binary sparse vector’, and then hashing the results. When the hashes are compared, similar anomalies stand out.
By matching similar metrics and clustering similar anomalies, it becomes that much easier to understand when two anomalies are related, perform root cause analysis and mitigate the problem.
Practical Applications of Anomaly Correlation
What does anomaly correlation look like when it’s applied in the real world?
Imagine that you’re a software developer with a premium mobile application. The premium version of the application is around $100 – much more expensive than most apps – so the purchase volume is fairly low. That’s why it takes around an hour for the anomaly detection system to see a drop in the number of completed purchases from a specific bucket of Android users.
Because every purchase is so valuable to the organization, it’s important to nail down the root cause as soon as possible. Since this is a real company, we can reveal that the organization did quickly find the cause, and was able to recoup $200,000 in sales that would have otherwise been lost.
The key was that their anomaly detection software noticed two things. First, at the same time the number of sales began to drop, there was a spike in 400 errors indicating bad requests. In addition, the errors began at the same time as an API update. This allowed the developers to trace the anomaly down to its root – which turned out to be a developer who had made “source” into a required field.
Other companies haven’t been so lucky. During a massive sell-off in stocks that occurred on August 12, 2019, funds owned by the Vanguard Group appeared to take an accelerated nosedive, losing up to 56 percent of their value. As investors reeled, the company reassured them that the losses were a glitch caused by an error in the NYSE.
Correlation would have helped triangulate the root cause faster in this instance. Although stocks do go down in the normal course of events, a faster drop than normal would have caused an alert. At the same time, the system would have noticed that information from the NYSE was no longer forthcoming. Analysts could have quickly put the dots together using these alerts and then warned their clients before they panicked about their portfolios.
If you have a major issue that needs all hands on deck, and a minor issue that can be handled by the front desk, you’ll likely devote your resources to one and not the other. When anomaly detection correlates these issues, it creates the opportunity for you to restore customer satisfaction and marshal your support resources in a much more effective manner.