Resources

FILTERS

Resources

Blog Post 4 min read

Seven Lessons To Get You Through the First Two Years in a Startup

  It feels like just yesterday we painted the walls of our office and started our journey of building Anodot, a machine learning SaaS platform for detecting business incidents in real time at massive scale. Since that day, two years ago, we’ve learned many lessons as we’ve grown our company. Lesson 1: Superstitions can help you explain the unexplainable On day one we were six – Menny, Yonatan, Yuval, David, Shay and myself – and on the second day we added a seventh – Anofish. Anofish turned out to be a crucial member of the team – when he felt bad, we hit lows – our system became unstable, critical bugs surfaced, and promising leads turned sour. When he was active and happy, it was the other way around. Luckily, he only died twice and has been healthy for quite some time — knock wood. Which leads us to the next lesson… Lesson 2: Be prepared for the worst, even if you know it will never happen…because actually it will. We learned that thwarting the evil eye is a day to day task in startup life, i.e. ignore the evil eye at your peril. Everything that can go wrong, goes wrong – even if the odds are very slim. A one in a million chance of something bad happening turned out to happen more often than we thought. We now know that anomalies happen all the time, and they always happen when you least expect it. Luckily, this observation is exactly the reason there is a market for our solution, that detects anomalies for so many others. Lesson 3: Know how to talk about your technology even if woken up in the middle of the night. Lesson’s 3 & 4 relate to the many funny moments (aka embarrassing) from which we learned a lot. One evening, I got a phone call asking me why I haven’t arrived to a Meetup where I had promised to give a talk – realizing that I totally forgot, but still managed to rush there, I prepare a few slides in the car and gave a 1.5 hour talk about anomaly detection to a full room. Lesson 4: Don’t let Waze autocomplete the address on your way to an important meeting. And there was that day David arrived to an important meeting realizing that he found the right street, but the wrong city. Oops. Lesson 5: Data scientists don’t know shit about DevOps, at least this one doesn’t…Hire a pro. Co-founders have to wear a lot of hats, and we often find ourselves doing things that we weren’t exactly trained to do, just because, well, it’s got to get done. But there is a time and a place for a pro, and we learned that the hard way when our system went down on a Friday night because I accidentally deleted the security rule that allowed the servers to speak to each other. Double oops. The last two years have been a journey. We started with building the product, getting an alpha out to design partners, releasing the beta and deciding three weeks later that we need to redo the entire UI. Seeing the new product several months later, the excitement of our first sale, and the happiness that it wasn’t just a fluke – and there have been many, many more sales since then. We also grew our team…which leads us to lesson 6… Lesson 6: Don’t take yourselves too seriously. …because after Anofish came Irit – my evil alter-ego mannequin. And finally, Lesson 7: Surround yourself with great people that you enjoy seeing every day. 
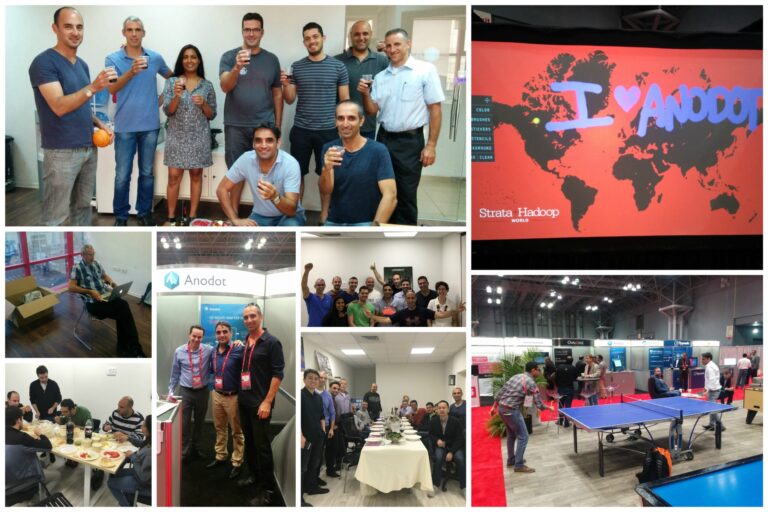
We came back to recruiting actual humans after Irit. With the addition of Tomer, Asaf, Sharon, Meir, Amir, Uri, Jon, Bill, Rebecca, Mark and Kevin, we have an awesome team that makes it so easy to come every day to the office and work through the ups and downs of startup life. Just like having a child, there have been joyous moments and sleepless nights, many ups, and many downs. But we never lost faith that we have the most beautiful and gifted child in the world. We know our child will succeed, and we’re here to make sure she does. So here’s to the terrific twos!
Documents 1 min read

Case Study: AI-powered Analytics Ensures Customer Satisfaction at LivePerson

Addressing some of the most challenging customer engagement problems, the LivePerson team needed to know when a problem was brewing, to ensure that its more than 18,000 customers were getting the most out of their solution. Find out how Anodot helps LivePerson to easily track in real time massive amounts of business-critical data, enabling their customers to get the most out of the LivePerson platform.
Blog Post 4 min read

Anomalies are officially cool: Gartner names Anodot a 2016 "Cool Vendor" in Analytics

We've always thought anomaly detection and business incident detection were cool. And now Gartner says so, too. We are so honored to have been named a "Cool Vendor" in Analytics by Gartner, the world’s leading information technology research and advisory company. Each year, Gartner identifies new Cool Vendors in key technology areas and publishes a series of research reports about them. This year, the Report named Anodot as one of five "innovative vendors that are redefining the types of analysis that it is feasible for organizations to perform. They are doing so by providing high levels of automation or extending analytics' reach to new classes of user and new types of decision.” And what is it, exactly, that makes us so "cool"? We believe that it's our technology that sets us apart. Our automated business incident and anomaly detection platform enables business analysts to uncover issues in vast amounts of streaming data without manually setting thresholds or prioritizing which metrics to track. Intelligent behavioral correlation and grouping automatically identifies the impact of multiple anomalies that, when taken together, can have a meaningful impact. Our SaaS solution is based on patented machine-learning algorithms that isolate issues and correlate them in real time to alert users to a need for action. So what does that look like in action? Wix needed a real-time alert system that would indicate issues without manual threshold settings in the key metrics. Read more to find out how Anodot proved to be the system required for providing the necessary insights to the company’s analysts. Anodot enables Credit Karma to identify relevant and actionable incidents each day; that is, issues that have a business or technical impact. Check out how three Credit Karma teams are currently relying on Anodot’s business incident detection with the eventual goal to roll out access to all the teams in the company. Uprise found that with so many metrics, with traditional solutions, one must choose what to monitor, but with Anodot, they simply monitor everything, letting Anodot do the work of identifying anomalies. Read more to find out how Uprise now uses Anodot to track KPIs such as revenue, spend, fill-rate, and performance. For a large digital printing company, Anodot automatically analyzes the hardware and software data that the company collects from each press. Find out how Anodot detects potential problems early, allowing the company to provide proactive support. The Report states: The question that leading companies are now asking is not "How do I improve this analysis?" but "How do I improve this decision?" This question drives analytics into new realms of possibility — the "white space" where analytics tools have not traditionally been used as part of the decision making process. And that is, actually, what drives us. We work tirelessly to bring tools which help businesses leverage their data for the decisions that count. We believe that our business incident detection solution prepares our customers for the business decisions they face each day. I’d like to thank Gartner and their experts who performed an in-depth analysis of Anodot and our unique industry. We are thrilled to be included with other top notch companies working tirelessly to bring effective analytics and next generation BI tools to the market. I'd also like to congratulate the other companies recognized alongside Anodot - Cognitive Technology, OnlyBoth, ThoughtSpot and Veriluma. Read the full report: Cool Vendors in Analytics, 2016 (requires a Gartner account), authored by Gareth Herschel, Whit Andrews, Rita L. Sallam, Lisa Kart, Marc Kerremans and Cindi Howson, 19 May 2016, ** Disclaimer: Gartner does not endorse any vendor, product or service depicted in its research publications, and does not advise technology users to select only those vendors with the highest ratings or other designation. Gartner research publications consist of the opinions of Gartner's research organization and should not be construed as statements of fact. Gartner disclaims all warranties, expressed or implied, with respect to this research, including any warranties of merchantability or fitness for a particular purpose.
Documents 1 min read

Case Study: Real-Time Monitoring & Anomaly Detection for Telecom

Even the tiniest drop in service quality or availability not only impacts customer trust, but can cost a telecom company millions of dollars. Anodot automatically analyzes the vast volumes of network data generated from multiple sources, helping Telcos to optimize service levels, minimize overhead costs and maximize profitability, ensuring customer loyalty and maintaining overall network performance.
Blog Post 3 min read

Credit Karma and Anodot for Better Business Incident Detection

We are excited that Credit Karma selected Anodot for their business incident detection needs. In case you haven't heard, Credit Karma provides free credit scores and financial recommendations to 50 million members. They chose Anodot after they had tested multiple monitoring solutions and considered developing in-house. With hundreds of thousands of business and technical metrics to monitor to keep business running smoothly, the multiple teams within Credit Karma have used various tools, but still had delays of 24 hours or more before they could identify important business incidents. “It used to take us up to several days to identify an issue on a specific page, offer, or service that was draining our revenues,” said Pedro Silva, Credit Karma’s Senior Product Manager. “Anodot identifies when a metric increases or decreases in real time, so we can resolve it quickly, before business suffers or revenue is lost.” “We see many companies that encounter a similar problem to Credit Karma; they collect massive amounts of data but do not have a way to access the insights that are meaningful for the business in real time,” said Uri Maoz, Anodot’s head of US Business. “Today’s business intelligence solutions are too static to keep pace with the dynamic nature of online and mobile business; Anodot’s real-time machine-learning driven solution is becoming a must-have for web-based businesses.” Today, using Anodot, Credit Karma identifies several relevant and actionable issues that have a business or technical impact each day. Credit Karma's revenue analytics, technical analytics and marketing teams are currently relying on Anodot’s business incident detection; the eventual goal is to roll out access to Anodot to all the teams in the company. Seamless Integration for Immediate Impact Anodot's ability to seamlessly integrate with Credit Karma's existing infrastructure was a key factor in their decision to choose our solution. The implementation process was smooth, allowing Credit Karma to start benefiting from real-time insights almost immediately. This quick turnaround time has enabled them to prevent potential revenue losses and maintain a high level of service quality for their members. Future Expansion and Proactive Monitoring Looking ahead, Credit Karma plans to leverage Anodot's advanced capabilities to further enhance their operational efficiency. By expanding the use of Anodot across more teams, they aim to proactively address issues before they impact the business, ensuring that they continue to provide their members with accurate and timely financial recommendations. To learn more about how Credit Karma uses Anodot to identify relevant and actionable incidents each day, read the full case study here. Read the full press release here.
Documents 1 min read

REAL-TIME ANOMALY DETECTION & ANALYTICS FOR E-COMMERCE

E-commerce sites are click- and usage-driven, and customer engagement and revenue are intricately tied together. Early detection of business incidents translates into an agile site that can respond to changes quickly for increased traffic, sales and revenue, optimized ad campaigns, and satisfied customers.
Blog Post 4 min read

Traffic Patterns: A Closer Look at the Bay Area Bike Share

We recently took a closer look at data made publicly available by the Bay Area Bike Share to see if we could find some anomalies by streaming the available data into Anodot's business incident detection system. The company, based in the San Francisco, set up bike rental stations throughout the Bay Area. Users can sign up for a 24-hour, 3-day or annual membership, which grants access to the bikes. When examining the numbers, we found seasonality consistent with what was demonstrated in the 2014 Data Challenge. For example, in the graph below - Total Number of Rides - there are many more rides on weekdays and fewer on weekends and holidays. The constant numbers probably indicate that the bikes are being used by people that need to get from point A to point B on a regular basis...in other words, commuters. In the graph below - Ride Duration - weekday rides average 10 minutes, while weekend rides are nearly twice as long. This also is indicative of weekday work/weekend pleasure usage. We then looked at the number of rides for annual subscribers (green) versus other customers, also called non-subscribers (blue). The graph below shows that non-subscriber rides peak on the weekends. There are fewer non-subscriber rides on weekdays, and the opposite is true for subscribers. This makes sense if the subscribers are using the bikes to get to work, since they (hopefully!) aren't working on weekends. Non-subscribers could even be tourists. Additionally, the length of rides (in minutes) for subscribers (green) versus non-subscribers (blue) varied greatly. We see below just how drastically the length of rides varied. Subscribers ride for an average of seven minutes, while non-subscribers ride from 20-40 minutes. We also see that ride duration is much longer on the weekend. When we looked at the number and duration of rides together, the following graph shows the duration peaks are anticorrelated with the number of rides (and happen on the weekend). So, with the data as our basis, we can jump to some interesting conclusions: that Bay Area Bike Rider subscribers are residents who most likely use the bike share for commuting to and from work while non-subscribers (i.e. other customers) are tourists or visitors who don't ride much during the week but use the program for longer sightseeing and recreational rides on the weekends. From the shape of this data, it seems that Bay Area Bike Share is providing a crucial service that replaces other forms of commuting, such as car or bicycle ownership, or another form of public transportation. And as for the anomalies...of course there were major drops in number of riders during Thanksgiving and Christmas/New Years. More interestingly, you can see the anomaly below that we found an anomaly (a decrease) in ride duration that originated from the 2nd at South Park station. It happens immediately after a long period of duration increase. You can see in the graph that the length of time each person kept the bike increased over time, and then suddenly decreased. To understand this a bit more deeply, we compared rides that started at this station with rides that ended at it, and it's clear that the growth trend happened only with rides that started there, not those that ended there. Our initial guess was that there was some construction in the area that may have lengthened the riding time, but we researched it a bit and did not find anything relevant. The increasing duration was consistent to the two main stations that riders rode to from this station, in two completely different directions. Another possibility is that there was an increasing problem with subscribers unlocking the bikes that was then fixed. Units in the graphs above are seconds, so you can see that the major drop (which was maintained afterwards) was around three minutes. We also noticed a major anomaly in mid-December, when the duration spiked. We checked with Bay Area Bike Share and one of their employees, Ashley Turk, explained that this could have been due to outlier trips of greater than two hours during that time period.
Documents 1 min read

REAL TIME ANOMALY DETECTION AND INSIGHTS FOR ADTECH

In programmatic advertising, every minute translates into tens of thousands of dollars, and Anodot gives advertising technology companies the crucial insights you need in real time.
Blog Post 3 min read

Stop Drowning in Your Google Analytics Data

Like most web based businesses and SaaS companies, one of our go-to tools for a quick check of the usage of our service is Google Analytics. Typically we log in and we see the pleasing wave of application traffic, with the predictable seasonal drops during the weekend, and increases during the week. We get a daily report of usage per customer and look at the main flows in our service. Rapid Anomaly Detection Of course, Google Analytics is a great source of time series data, so we decided to stream the analytics about the Anodot application into the Anodot service, to see what our algorithms could discover. Sure enough, we quickly uncovered some interesting anomalies, such as this one, showing a major traffic drop at one of our customers for one of the pages in our app (one of about 50). When we checked a little further, we saw that a similar anomalous drop was happening to multiple clients, and it all happened at the same time. Challenging to Investigate the Issue in Google Analytics Interestingly, when we went back to Google Analytics to see what we had missed, we saw… not much. In fact, if you look at the Audience Overview graph (below) for the same period, you might notice a slight drop in sessions, but nothing major. Yet Anodot picked up and highlighted an anomaly in seconds. What gives? If we dig a bit deeper within Google Analytics, especially knowing exactly what time period, page and customer to look for, we do see that there was a major drop in total pages viewed during the period in question:   But even with Google Analytics Page Views graph, it can be challenging to detect the issue and isolate the root cause, or to understand which customers are most affected, and which pages, and what the heck is going on. Anodot Finds the “Slow Leak” Using Anodot it was very easy to do a quick root cause analysis. Turns out we had done a version upgrade right before the drop. The upgrade caused an issue in part of the app, but didn't break it, just reduced the page views. Of course if it had broken something major, we would have seen it right away (and been flooded with phone calls). But since it was a “slow leak,” we might not have noticed it for weeks. In Google Analytics, the issue was hard to spot and isolate, but with Anodot’s Business Incident Detection Platform, we immediately saw the drop, correlated it with the software upgrade, and quickly rolled out a fix. -- Start detecting anomalies in your Google Analytics data now.