Resources

FILTERS

Resources

Documents 1 min read

REAL-TIME BUSINESS INSIGHTS FOR MEDIA COMPANIES

Gain valuable insights from all of your data in real time, with Anodot time business incident detection and analytics.
Blog Post 2 min read

View Your Anomalies More Quickly with New Anodot Upgrade

We recently announced a version upgrade to the Anodot service that included a new feature: Anomaly Dashboards, aka Anoboards. Huh? I thought Anodot Always Had Dashboards Since the beginning of time (ok, since the solution was launched), Anodot offered dashboards, which is the central repository for accessing and viewing groups of metrics. Dashboards are tiles that you can use to track whatever metrics are most interesting to you. Tiles can be graphs, meters, even free text. For more information about working with dashboards, see the relevant help section. Anoboards are Dashboards for Anomalies Anoboards are similar to dashboards in that they are shortcuts to view information that you need quick access to. They let you create customized dashboards that show anomalies for a predefined set of metrics. An Anoboard is a new way for teams and individuals to create customized views of anomalies within a set of metrics that represents the parts of the service that are their responsibility to track. More info about how to set up and use Anoboards in our online help. Anoboard Uses Let’s say you are responsible for conversion on an ecommerce site, you might track conversion from each region you are responsible for on a dashboard. However to see where (or even on which server) conversion suddenly spiked or dipped, the anoboard will give you quick access to see exactly where it happened, so that you can investigate it quickly. Similarly, if you are a factory manager you might want to always view a dashboard of machine temperature for the thousands of machines you monitor. Perhaps you would set up an average of all the machines to display on the dashboard. But if you want to check to see which machine is suddenly heating up more than the others, you could see that most easily on an anoboard. Different Roles, Different Anoboards Most of our customers have lots of people using Anodot, each for his or her own incident detection needs. For the executive user, tracking revenues is most important, for the operations user product inventory or factory output, and for the technical user CPU and server errors. All of these and other roles can benefit from Anodot, and using anoboards and dashboards, each user or user group can create their own shortcuts to see exactly what interests them, to get the most out of the system.  
Documents 1 min read

Anodot for Fintech: Real-Time Revenue & Cost Monitoring

As a financial technology company, you deal with a vast number of critical data streams that behave in complex ways, such as transactions, payments, money transfers or loans. Performing with the highest standard of availability and reliability is a crucial asset to securing customer trust.
Documents 1 min read

REAL-TIME ANOMALY DETECTION & ANALYTICS FOR THE TRAVEL INDUSTRY

Learn immediately if any of your key indicators are under- or over-performing, including numbers of passengers to and from specific cities/regions, brand or display advertising click-through rates, flight delays due to technical issues, customer service communication counts, average resolution time of support calls, number of bookings or cancellations, weather per geographic region and holidays per country.
Blog Post 2 min read

Case Study: Anodot Keeps an Eye on Eyeview Revenue

I'm excited to share this new customer case study in the ad tech industry. Eyeview is a New York-based video advertising technology company that provides brands with ROI on their video advertising spend. Their VideoIQ® platform provides best-in-class access to highly viewable and guaranteed fraud-free inventory across television, desktop, tablet and mobile. In the real-time bidding business, traffic is king. Eyeview deals with enormous amounts of traffic and they must make complex decisions with minimal latency. With so many indicators and data streams – a spectrum of around 200k metrics – the throughput is so high, they’ve got less than a second to analyze each query. Enter Anodot. Eyeview recognized its need for an anomaly detection platform to improve its alerting method. “For me, the main value of Anodot is being a single system monitoring, detecting, and alerting on everything that happens within Eyeview,” said Gal Barnea, Eyeview’s CTO. “Anodot adds another tier of protection to company revenue.” Read the full case study here to find out how we help Eyeview by delivering accurate and timely warnings, as well as providing rapid signals for positive anomalies of their most critical metric – the number of ads served. Next step? Eyeview's business team will start using Anodot to monitor revenue, delivery and financials. What features do you look for in revenue loss prevention tools? Read the case study. -- image source: http://www.higheredtechdecisions.com/
Documents 1 min read

Network World: Anodot uses real-time analytics and anomaly detection to provide business insight

Linda Musthaler, Principal Analyst with Essential Solutions Corp. delves into the benefits of Anodot for companies that need real time business insights.
Blog Post 3 min read

Monday Morning Quarterback: Super Bowl Advertising Really Works

The stands have emptied. The Broncos and the Panthers played a great game. And of course, Lady Gaga just might have been the best musical performance during the game…and possibly ever…I digress… Now that the confetti has settled, advertisers are eagerly reviewing the data to see if they hit their goals. With spots running in the millions, advertising during the biggest game of the year is no pee-wee sport. The Second Screen Phenomenon Strikes Again 
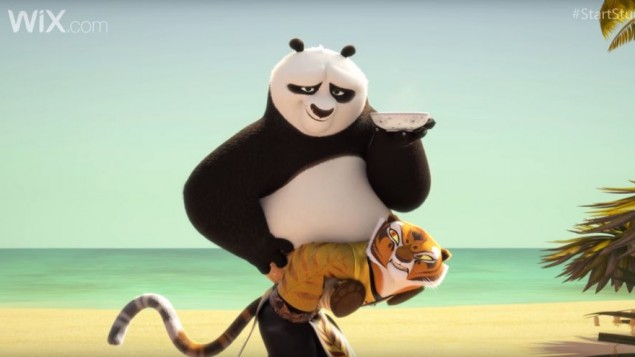
In our post last week, we discussed our client, Wix, and the second screen phenomenon during their 2015 Super Bowl ad campaign. During last year’s Super Bowl Wix saw a huge spike (a.k.a. an anomaly) of traffic when their ad aired on television. The data we examined proved that people actually watched and reacted to the ads by accessing the Web on a second device. So how did they fare this year? Second Screen Behavior Continues For the second year in a row, Wix came out a winner. Below is a graph showing the days leading up to the Super Bowl and the actual day of the game. Note the fairly regular seasonal pattern as the traffic goes up and down each day. Slide your eyes to the right and you can clearly see the spike in traffic. While the Anodot anomaly detection system correlated 240 (!) different application metrics with simultaneous anomalies, the two metrics shown here show jumps of more than 900% in one case, and more than 1000% in the other. In other words, a huge jump in traffic all over the site, including the sign-up page. Note that the anomaly score for this traffic spike is 98, that is, 98 out of 100. In other words, not just a hop, but a huge, massive jump, worth taking note of, and a huge jump across hundreds of tracked metrics. Now what about the second screen phenomenon that we witnessed last year? Sure enough, people are browsing from the closest thing at hand; mobile and tablet browsing to the Wix site jumped by 150% when their ad aired, while browsing from traditional PC “merely” doubled. Digital receivers, i.e. people browsing right from their TVs, while still only accounting for a tiny fraction of total traffic (so small, in fact, that you can barely see it on the graph below), saw a 1000% increase. A Winning Campaign With regard to last year, Wix’s VP Marketing Omer Shai said in an interview with Fortune: “We did pretty good in terms of the amount of money we got back from the campaign we did. It gave us great confidence in doing it [another Super Bowl ad] again.” What’s great for Wix is that since they are a web-based business, with optimized pages they can immediately convert a large portion of their Super Bowl traffic into business. These traffic results are on par with what any advertiser could hope for following a large scale campaign like this. So…who’s going for an advertising touchdown in 2017?
Blog Post 2 min read

Touchdown! Super Bowl Advertising and Second Screens FTW!

Everyone knows that scoring ad time during the Super Bowl is a turning point for any business. The Super Bowl is, perhaps, the pinnacle of advertising. Many have wondered, though, if the high ticket price and the effort to create a spectacular ad is actually worth it. Companies pull out all the stops. They push all boundaries and spare no cost. But is it really worth it? Do those ads actually drive traffic? Wix, the cloud-based website development platform and an Anodot customer, ran an ad during last year’s Super Bowl and are looking forward to making waves with a new ad slot this year when the Panthers meet the Broncos. We took a look at the metrics Wix sends to Anodot for anomaly detection, and sure enough, during the 2015 Super Bowl there was indeed a huge spike (a.k.a. an anomaly) of traffic to Wix. As you can see based on the huge jump in the screenshot below, people actually are watching and reacting to the ads. They’re not just watching the ads so they can compare notes at the watercooler the next day, they’re actually paying attention and reacting. The most traffic  came from mobile devices, which reinforces the notion of a second screen phenomenon. Consumers are literally glued to their screens…multiple screens…and seamlessly move from one to the other. See an ad that sparks an interest? Consumers will look away from the television, pick up their mobile device and respond. In Wix's case, we saw a direct correlation in the air time and content consumption. “We’ve seen a direct impact from the Super Bowl,” said Doron Ben David, CTO of Uprise, an advertising platform and another Anodot customer. “In past games, traffic to our networks went down since people were busy watching the game, and then it increased significantly during the ads. Viewers are consuming content on multiple devices and interacting between them.” So what will Super Bowl 50 bring for advertisers and viewers this coming Sunday besides Wix's adorable upcoming Kung Fu Panda ad? We look forward to seeing the results in real time as we cheer from the sidelines.  
Documents 1 min read

Got Data? Get Insights. Fast.

A brief brochure about increasing business control with real time business incident detection, anomaly detection and analytics.