
Written by @InterpretableAI & @IraIraCohen
In the first and second part of the blog series, we discussed the importance of correlation analysis in root cause analysis in general and in the context of promotional marketing. In a similar vein, in this blog we walk through how to leverage correlation analysis to address challenges in the telecom space.
The data deluge experienced in the telecom industry has proven especially challenging during the pandemic and the jarring worldwide shift to remote work is expected to only get worse going forward. This can, in part, be ascribed to explosive growth in machine data, video surveillance, among other factors. As much as the unabated growth in data streams taxes telco networks, the data can be leveraged for a wide variety of use cases including, but not limited to, improving QoS and reducing energy footprint (telco operators already account for two to three percent of total global energy demand). For instance, McKinsey makes a case for using AI as analyzing “vast amounts of data relating to traffic patterns, real-time demand, and network-resource availability allows for quick, automated decisions on the parts of the system that can be put into sleep mode or shut down.”
The figure below lists the next generation of connectivity technologies. These will usher a whole new era of applications and further balloon data volume. To ensure high performance, availability (where up-times are expected to exceed five nines), reliability and security, high-fidelity monitoring will be a foundational requirement, not an afterthought.

Let’s take a look at two of these technologies from a business perspective:
- 5G wireless – support low-latency, high-volume communications
- Some use cases: manufacturing, health care (e.g., for telemedicine solutions), retail, transportation, and education (e.g., for distance learning)
- McKinsey reports that use cases in mobility, healthcare, manufacturing, and retail alone could potentially boost global GDP by $1.2 trillion to $2 trillion by 2030.
- A potential key driver for the proliferation of edge computing. IDC reports that there will be 41.6 billion connected IoT devices, or “things,” generating 79.4 zettabytes (ZB) of data in 2025.
- Enabling IoT at scale can help drive energy optimization. For instance, McKinsey suggests: “By placing sensors at various points to gauge grid-power input, fuel levels, the number of hours the generation set has been running, battery voltages, and consumption by different types of equipment and then analyzing the data, operators could uncover potentially costly anomalies.”
- Satellite internet
- McKinsey throws light in this regard by saying: “Low-earth orbit (LEO) satellites could also deliver a breakthrough — not necessarily in network performance, but in breadth of coverage. By essentially beaming broadband down from space, they could bring coverage to remote parts of the world where the economics do not work for laying fiber or building networks of towers.”
Further, the data can be leveraged by the telcos for their own sake as well. For example, network data can be leveraged to drive operational insights (such as predictive-maintenance models). Likewise, recent network key performance indicators can be used to train models monitoring customers’ propensity to churn. It’s not uncommon to correlate one or more operational metrics in {latency, packet loss, jitter, call drop rate} with business metrics such as, but not limited to, ARPU (average revenue per user) and churn rate.
In addition to driving operational insights, correlating these metrics when an incident is detected has been proven to accelerate root cause analysis and remediation, resulting in reduced incident costs.
In addition, telcos can leverage the troves data to hyper-personalize their service across B2B and B2C customers.

Source: McKinsey & Company
Akin to any other domain, the amount of data being collected in the telecom sector as well has been growing leaps and bounds. The figure below throws light on one possible taxonomy and, for each category, a brief list of signals that are supported by Anodot’s platform.
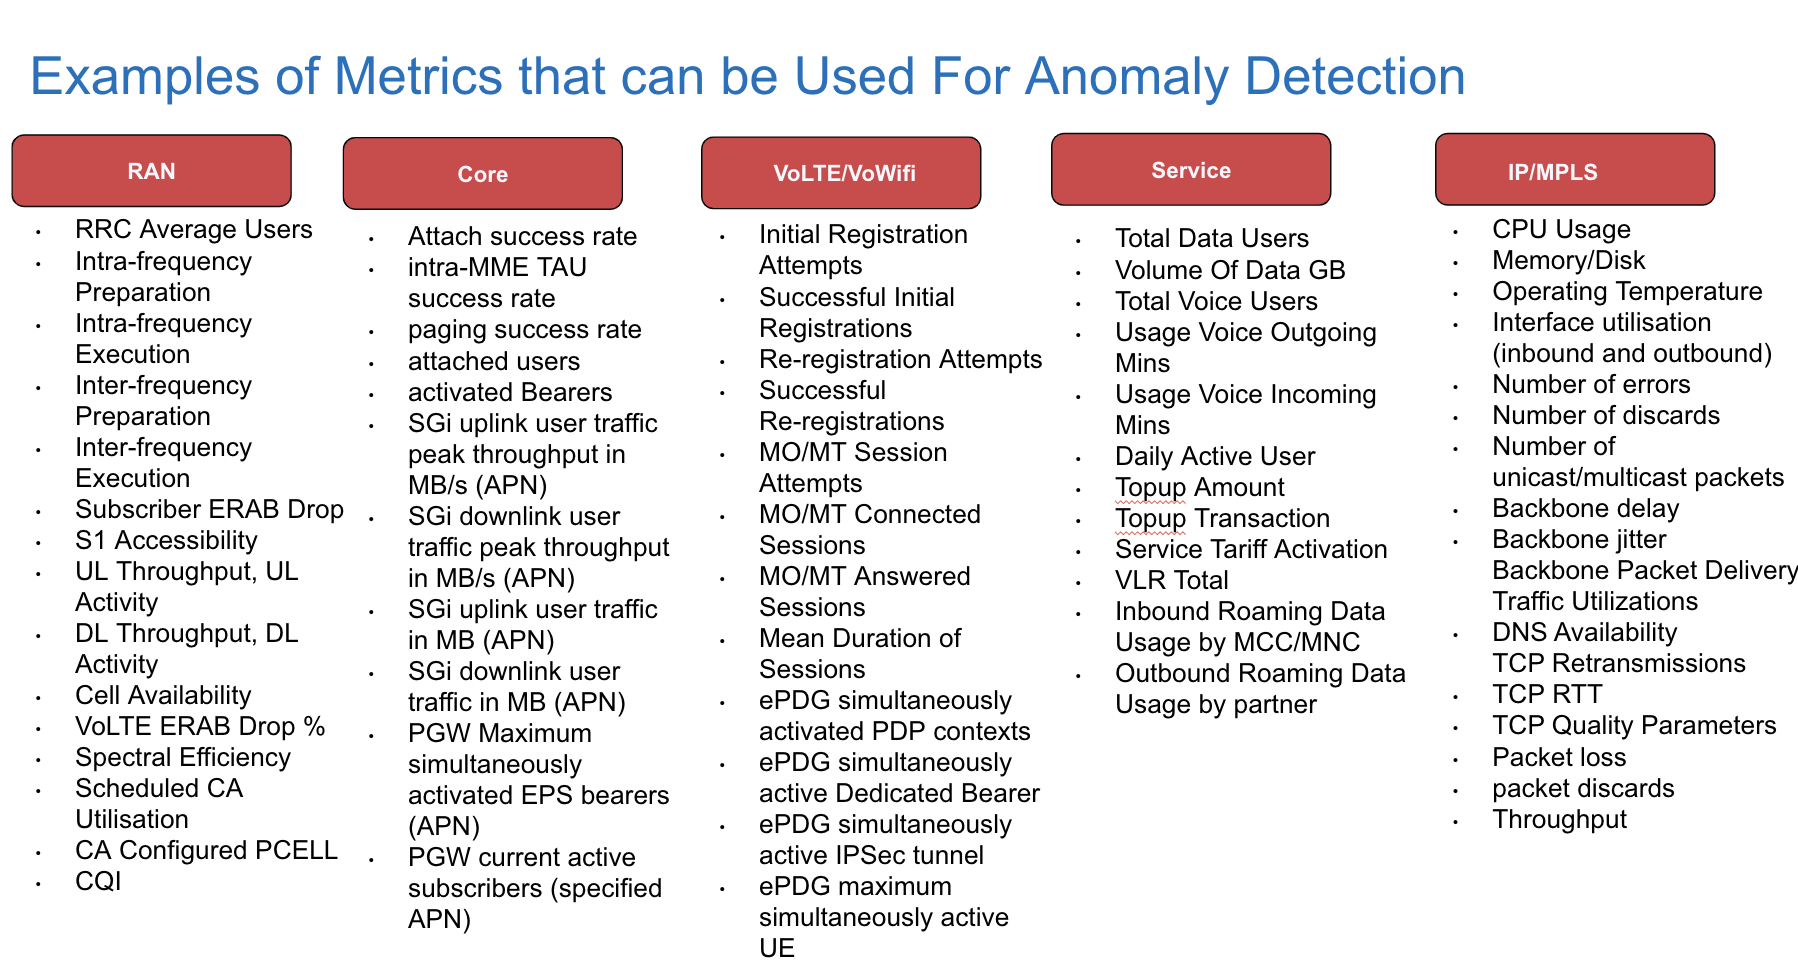
source: Anodot
The reader is referred to the work by Al-Shehri et al. for extensive discussion of metrics used in the telco space. Depending on the type of signals used for correlation analysis, one or more of the following actions can be pursued:
- Compression: reduce multiple occurrences of identical events
- Filtering: reduce number of alarms
- Suppression: inhibit an event subject to a certain context
- Escalation: increase the severity of an event based on frequency of occurrence
- Temporal Resolution: establish partial ordering between events
Further, correlation analysis can be leveraged to proxy causal analysis in the context of fault propagation. The figure below throws light on example scenarios where the root fault f is driven by one or more faults f1, f2, …, fn.
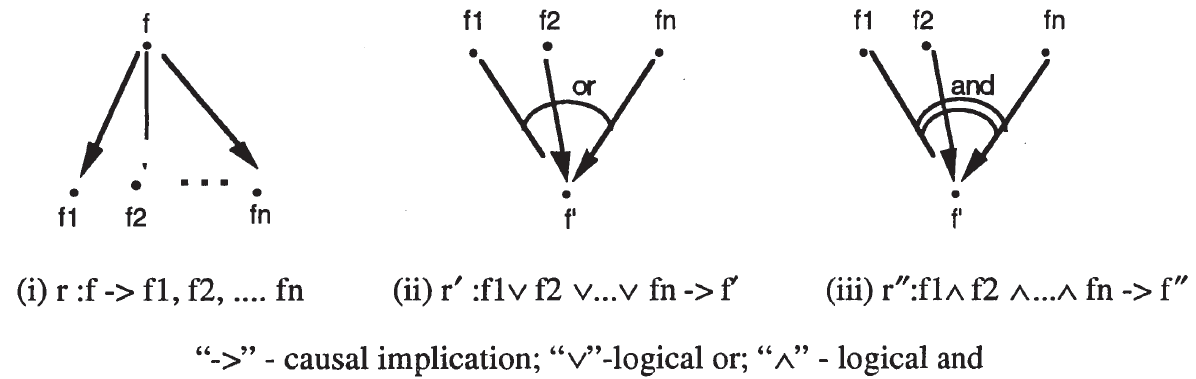
Traditionally, fault propagation rules were determined based on domain knowledge. This is clearly not scalable today when connectivity has become the lifeline of the world economy. Akin to other domains, statistical learning or reinforcement learning techniques can be leveraged to learn such rules from the data.
The correlation between the KPIs and the operational metrics can be linear (see “Contributions to Correlation Analysis” and “Robust Correlation“) or non-linear (see “A Simplified Computation of Non-Linear Correlation” and “Correlation Tests for Non-Linear Alternatives“) in nature. Further, the correlation between two metrics can change over time. The latter can stem from non-stationarity of the corresponding time series. In fact, more than often, we observe that most of the time series in production are non-stationary (in particular, they are heteroskedastic). Techniques such as, but not limited to, DCC can be leveraged to assess time-varying correlation. When more than one KPI is of interest, then, potentially, vector correlation (see “Correlation Between Two Vector Variables” and “Vector Correlation“) can be leveraged for analysis.
Most of the existing techniques for correlation analysis are best suited for data-at-rest. However, minimizing TTR (time-to-resolve) calls for carrying out analysis – in the current context, anomaly detection and correlation analysis – on data streams. Stringent SLAs at the customer end call for the use of data sketches. To this end, techniques such as the one proposed by Cormode and Dark can be used to detect unusual pairwise correlation in a large set of time series. We at Anodot also support a rich suite of correlation-based techniques in our platform to surface actionable insights. Last but not least, we capitalize on the topology of the underlying network to weed out computation of redundant correlations, from a root cause analysis perspective, to minimize time to remediation (TTR).
The following examples, based on production data captured by Anodot’s platform, highlight how discovery of correlations between different monitored elements in the network help understand the root cause of incidents.
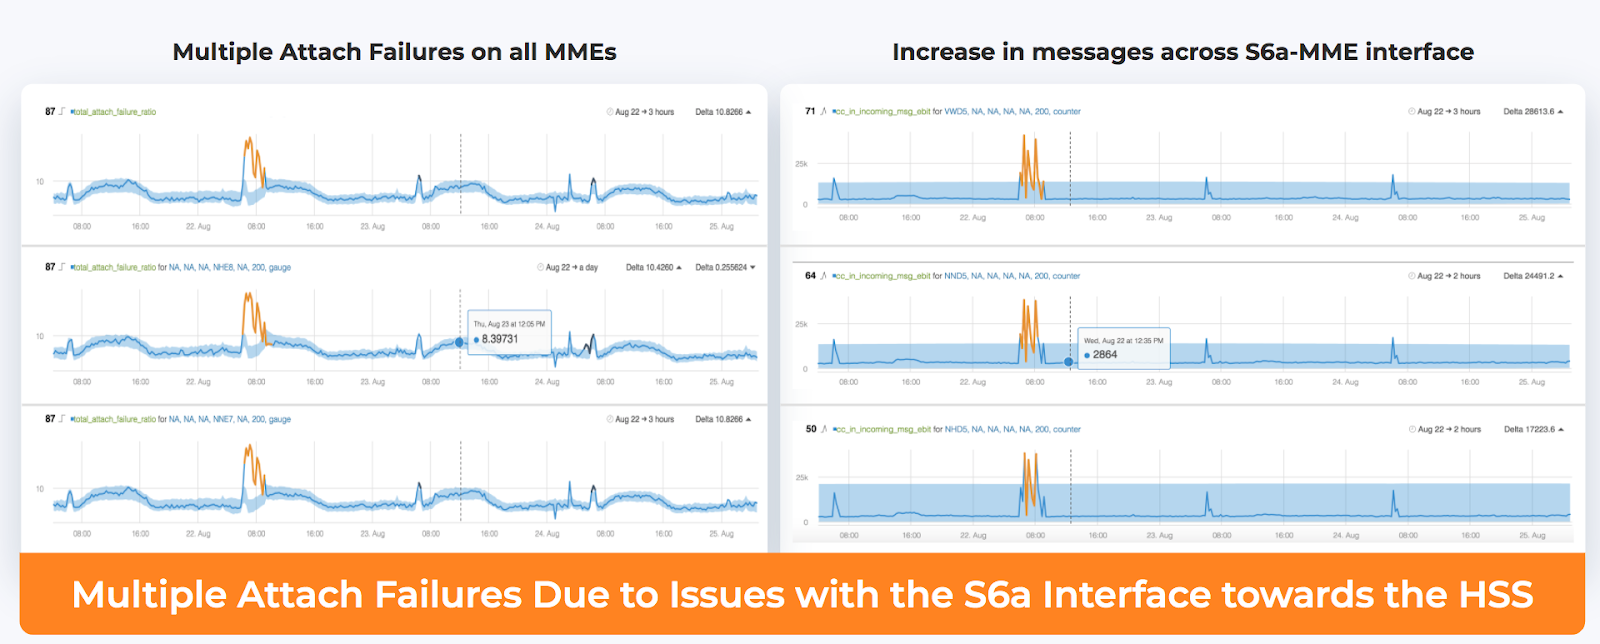
Source: Anodot
In the figure above, the correlated metrics and anomalies of an incident in the network are shown together. The incident impacted the network subscribers ability to connect to it, leading to degraded quality of service. In particular, the Mobility Management Entity (MME) manages the mobility and authentication of the subscriber. The MME is connected to a node called the Home Subscriber Server (HSS). The HSS contains all the subscriber information. The interface between MME and HSS is S6a. If the MME loses connectivity with the HSS due to interface S6a interface problems, then there will be an increase is attach failures (this is shown in the graphs on the left) and this is correlated with increases in the number of messages on the interface between the MME and HSS: subscribers keep trying to attach to the network, they fail and this increases the number of messages on this interface. By showing all correlated anomalies together, the root cause of the degraded performance is quickly understood and resolved, as can be seen with the metrics going back to their normal state.
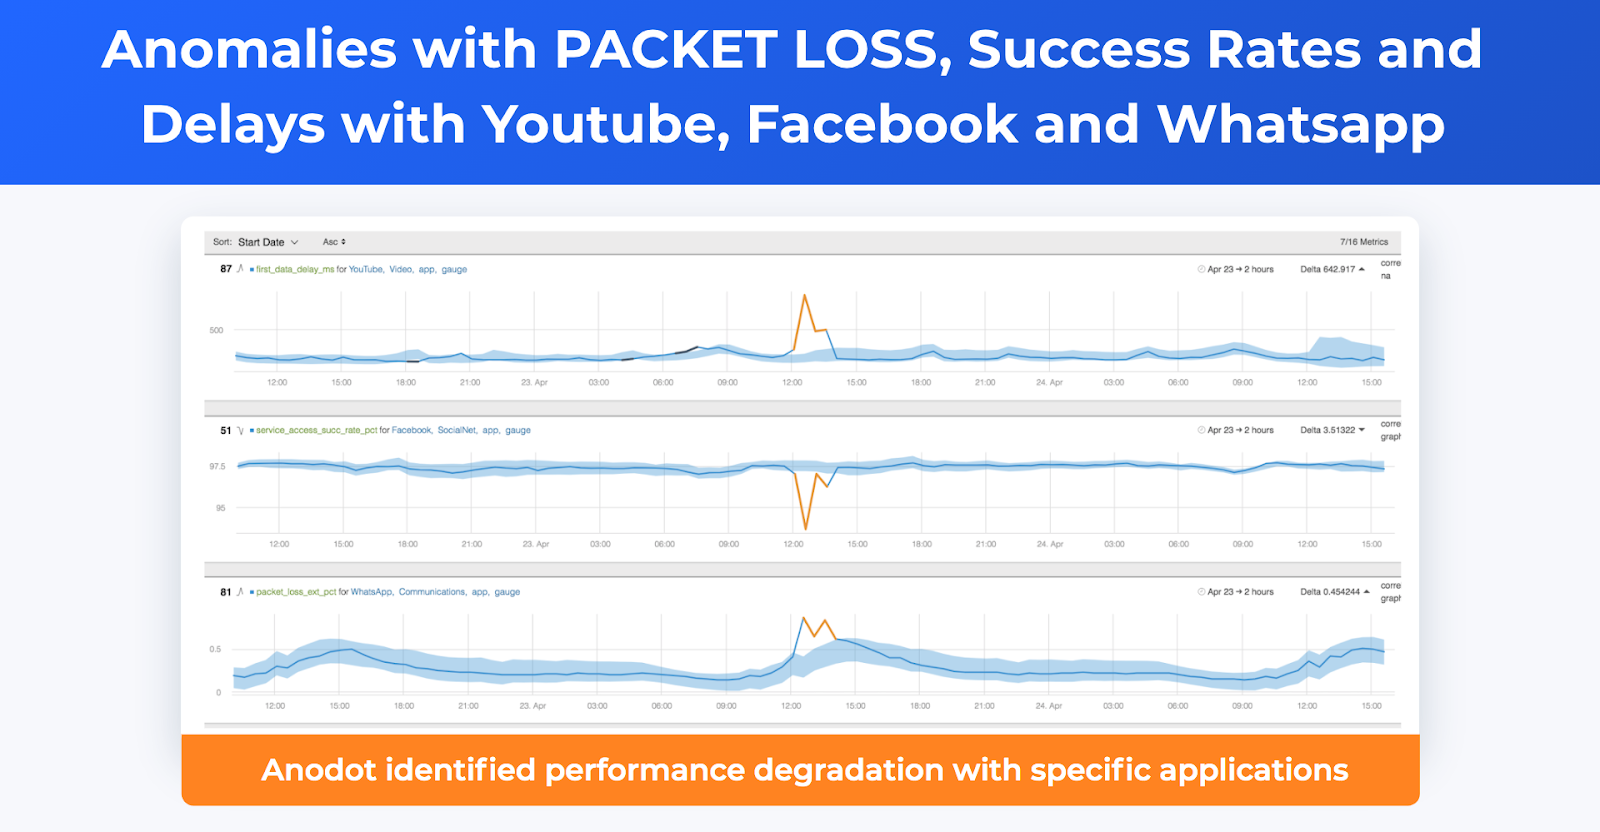
Increasingly, teleco providers are also monitoring service performance of common network heavy applications running on their subscribers’ mobile phones, as subscribers expect those applications to have good network connectivity. In the examples below, performance degradations of Facebook, Youtube and WhatsApp across a cohort of subscribers are detected, correlated and alerted on, indicating packet loss issues in the network.
Source: Anodot
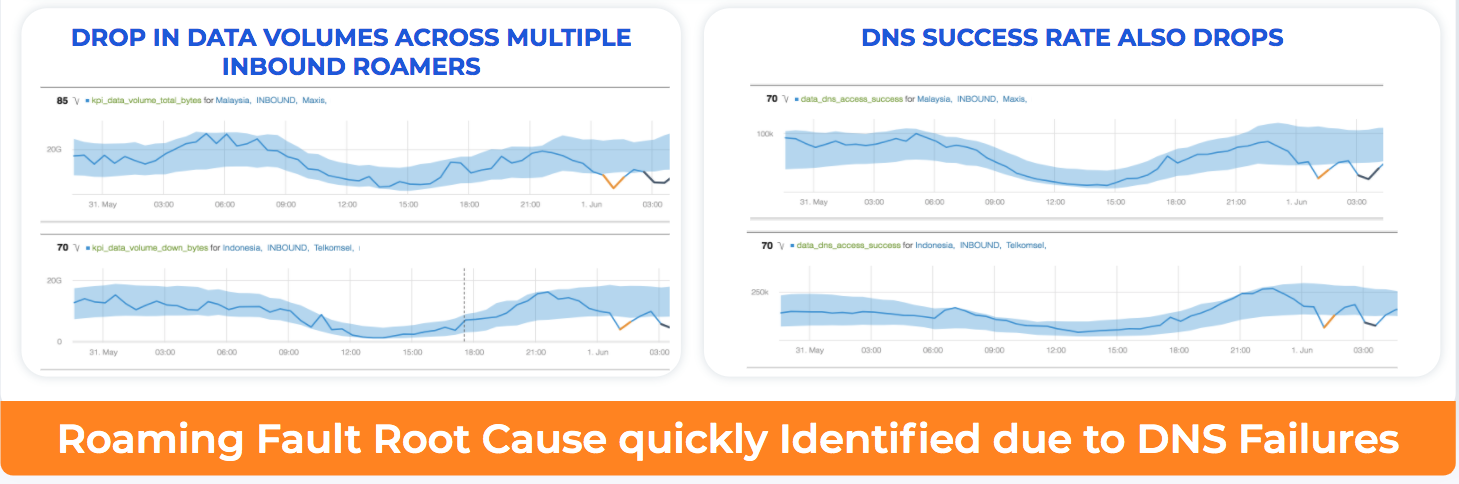
With increased mobility of subscribers across geographies, ensuring roaming service quality is also a critical factor in network performance. Moreover, a subscriber who is now in a different county and her data/phone plan does not work is in a particularly tough spot, as her ability to contact her provider is very limited. Issues with roaming, gone undetected, can have significant impact on churn. In the example below, Anodot correlated an anomalous drop in data volume from different inbound roamers (from multiple countries) to a drop in DNS success rate. The quick detection of the anomalies, coupled with correlation analysis, led to an accelerated resolution of the issue and minimized impact on subscribers.
Source: Anodot
The examples above highlight how correlation analysis can help pinpoint the underlying issue and consequently help with reduction of TTR.
Continue this series to discover applications of and challenges with applying correlation analysis in:
- a wider business context
- eCommerce, specifically promotions
- fintech, specifically algorithmic trading