
As the COVID-19 outbreak progressively impacts the world, many companies are grappling with the strain.
It’s a very uncertain time for business right now. Even with so many factors out of your control, but there are a few things you can do proactively to protect your business. Keep your customers happy. Do everything you can to provide the best customer experience and remedy leaks early.
As countries adopt work-from-home policies and social distancing, mobile usage is at an all-time high, according to a report by mobile usage analytics firm App Annie. In China, daily time spent on mobile increased 30 percent this February, the month after city lockdowns, compared to the average for 2019. Italy, the second-leading country in confirmed COVID-19 cases, saw the second highest jump in mobile usage at 11 percent, as of March 15.
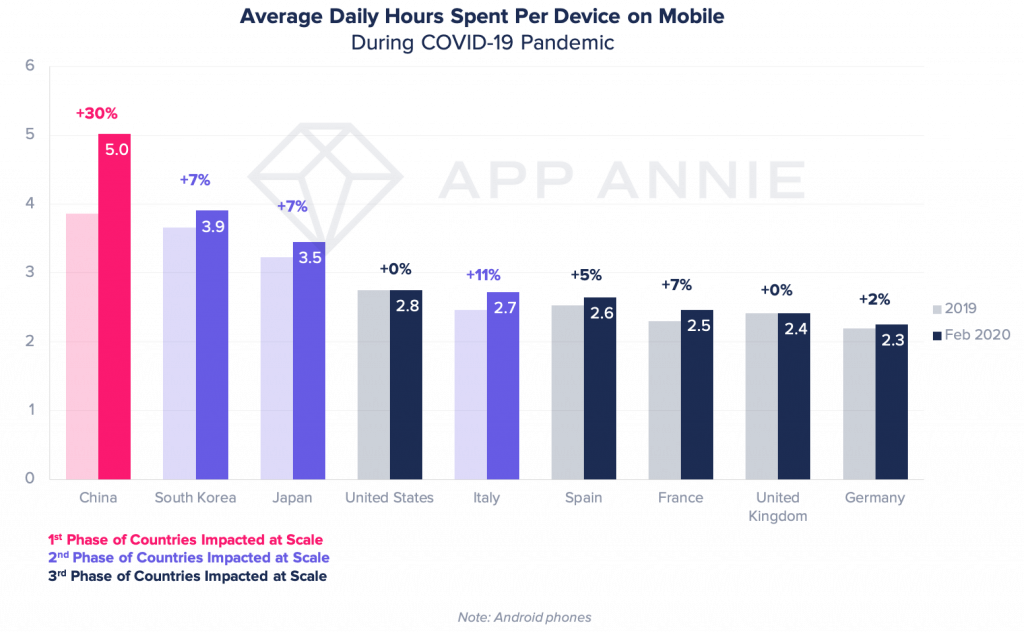
Source: App Annie
Keeping apps readily available and customer experience (CX) positive hinges on both front-facing and back-end metrics, and the correlations between business and application performance topologies:
- App infrastructure
- User interaction and usage
- Audience statistics
On top of the normal app usage statistics, interaction patterns are constantly being affected by external events such as holidays, new version releases and new competitors. While those influencing can add some uncertainty to how well your product performs on any given day, ensuring quality of service over the long term is what will stand the test of time.
What is Customer Experience Monitoring?
Customer experience monitoring has been done by piecing together web analytics and user experience analytics tools and trying to identify correlations. To get a complete picture, analysts usually evaluate application and IT metrics, user-related metrics, as well as influencing factors, such as industry competition and events (ex: marketing promotions and holidays).
The most prolific web analytics tools include Google Analytics, Mixpanel and Amplitude Analytics. Many companies also pair these with user experience analytics tools such as Fullstory, Hotjar and Pingdom, to get a fuller understanding.
A few of the most common customer experience metrics that companies track include:
- Net promoter score (NPS): NPS is a short survey that measures how likely someone is to recommend the product or service. Having a high NPS is an effective way to gauge customer satisfaction – directly from the customers themselves.
- Retention rate: The retention rate describes a company’s ability to keep its current customer base after they’ve been acquired. A high retention rate means that people continue to use a product or service after initially signing up.
- Churn rate: The churn rate helps you identify how many customers you’re losing over a given time period. A high churn rate generally means that customer experience is low.
While traditional analytics tools can be useful in reporting high-level KPIs, apps are complex and built from multiple layers, each one susceptible to different problems that can affect customer experience.
- On the infrastructure layer, customers may experience latency, long load times, or unresponsiveness.
- The application layer is prone to crashes, app errors and functionality issues, like broken links or buttons.
- The interaction layer is where you keep tabs on your traffic through logins, daily and monthly active users, etc.
These are just a few examples of problems that can surface, whenever such an issue occurs, on any of these layers, for any customer segment, customer experience is damaged. And whenever customer experience is damaged, revenues are directly affected.
The reality is that you often have to piece multiple solutions together to get a comprehensive understanding of your customer experience.
Why are CX Issues So Hard to Detect?
Customer experience is made up of thousands of different metrics, each exhibiting dynamic, seasonal behavior. In addition, the interactions between metrics and their impact on the business are unknown.
Most of the experienced glitches are small and hard to spot, we call those slow leaks. They leech onto your revenue and can do just as much damage, over the long-run, as the massive glitches. And, they happen more often than you think. Many businesses monitor using BI tools or by manually checking out dashboards. But at the current scale of customer interactions, traditional tools make it practically impossible to keep pace. And they leave incident remediation to chance. Not to mention, since metrics are reported after the fact, this means that you have to figure out how to use them reactively.
Machine Learning for Customer Experience Monitoring
Advances in machine learning have enhanced business monitoring, with solutions that surpass current BI and analytics tools in:
- Accuracy
- Continuity
- Efficiency
With these capabilities, automated monitoring is being used to improve customer satisfaction, reduce churn, and ultimately increase revenues.
As mentioned, one of the main challenges with using web analytics or user experience analytics tool is that customer experience issues (and opportunities) can often get buried when statistics are summarized into top-level KPIs.
In reality, however, since the customer experience is usually tied to so many different parts of an app such as the product, customer support, and payments, one small break in the chain can have a significant impact on usage and reputation. This means that in order to effectively monitor the customer experience you need a solution that can monitor the most granular metrics and respond to them in real-time.
There is an emerging market of AI analytics products, but very few are built to monitor business metrics. A solution like Anodot is among those that are using machine learning algorithms to monitor millions, even billions of events in real-time, learning how each metric normally behaves, and alerting you when things deviate from the norm.
In particular, a few of the metrics that Anodot autonomously monitors include:
- Daily active users
- Monthly active users
- Churn rates
- Retention rates
- Conversion rates
- Logins and authentication
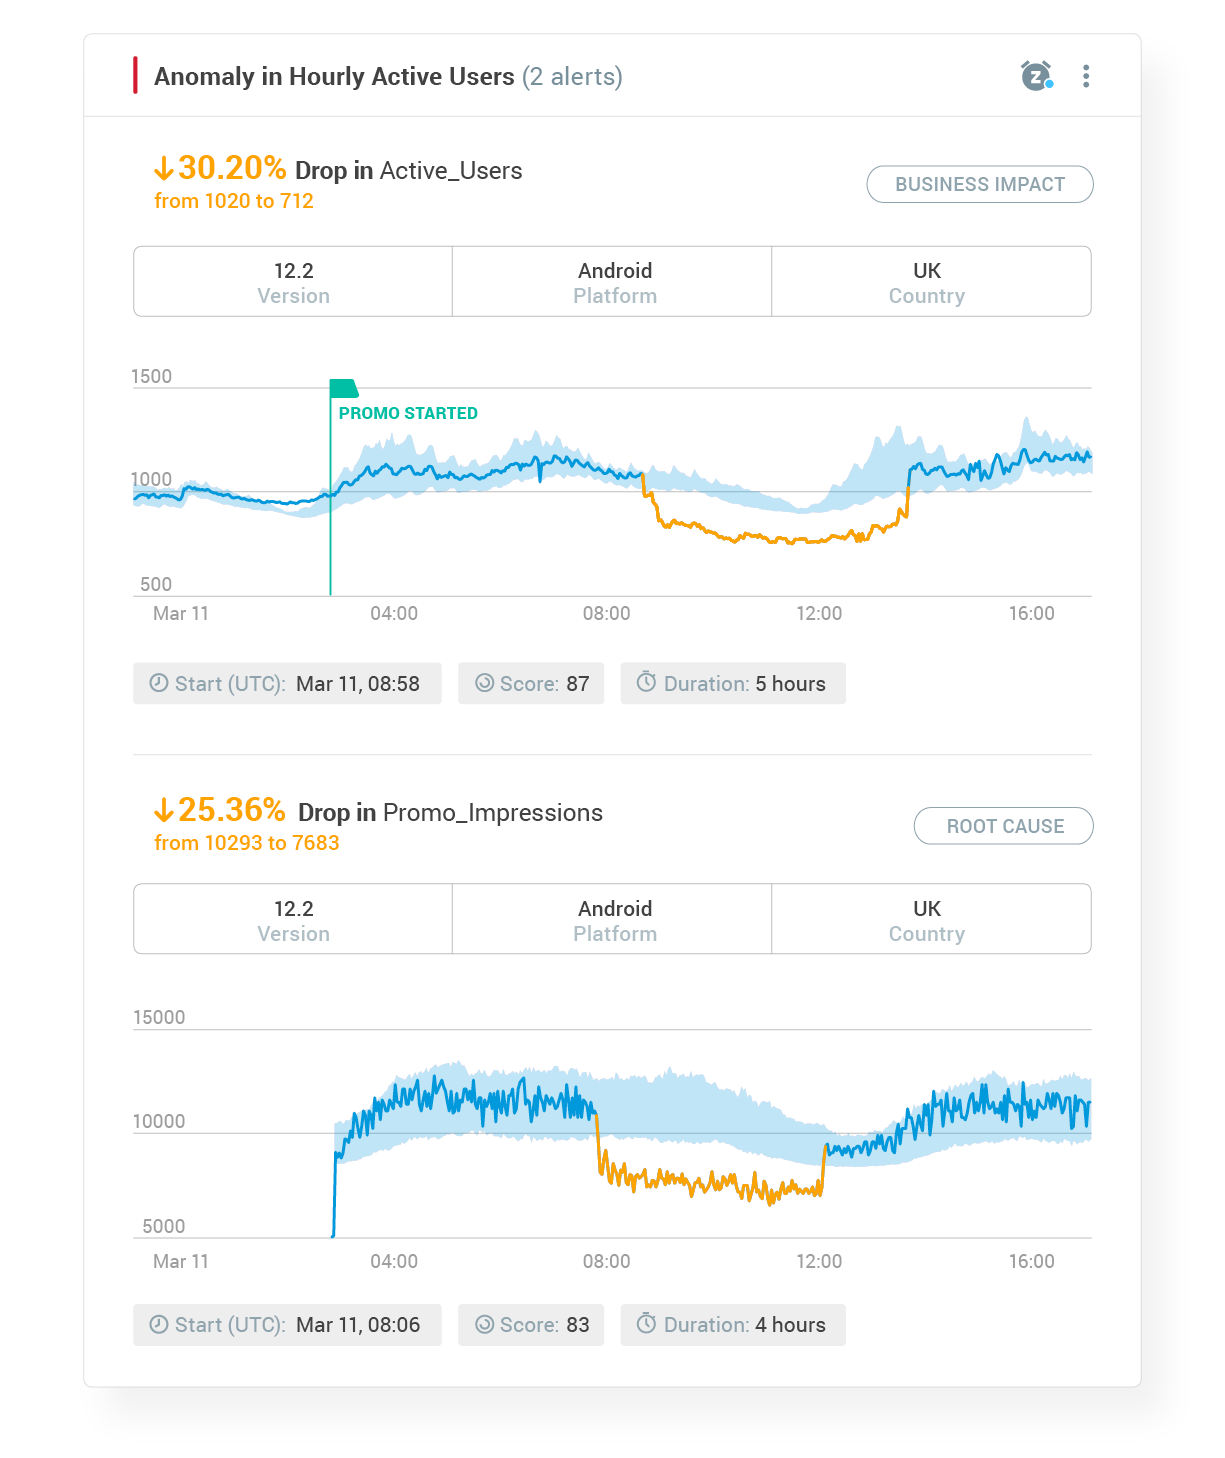
In addition to monitoring these metrics individually, Anodot’s patented correlation engine allows you to map out related metrics and events. This gives you a much more holistic understanding of critical events and significantly reduces your time to resolution.
As you can see from the image below, temporary user lapses will occur throughout the customer journey. Unlike traditional BI tools that require effort on your part to pull insights, automated monitoring pushes insights straight to your workspace (e.g., Anodot’s email alert below).
 Another one of the benefits of an automated solution is that it completely frees you from manual tracking or relying on human interpretation of the data. In particular, with Anodot you don’t even need to define what you’re looking for. Within minutes of connecting to the API or connecting to one of our built-in data stream collectors, our machine learning algorithms learn the normal behavior of all your business-critical metrics. From that point on, the system autonomously monitors all incoming data and identifies anomalous behavior.
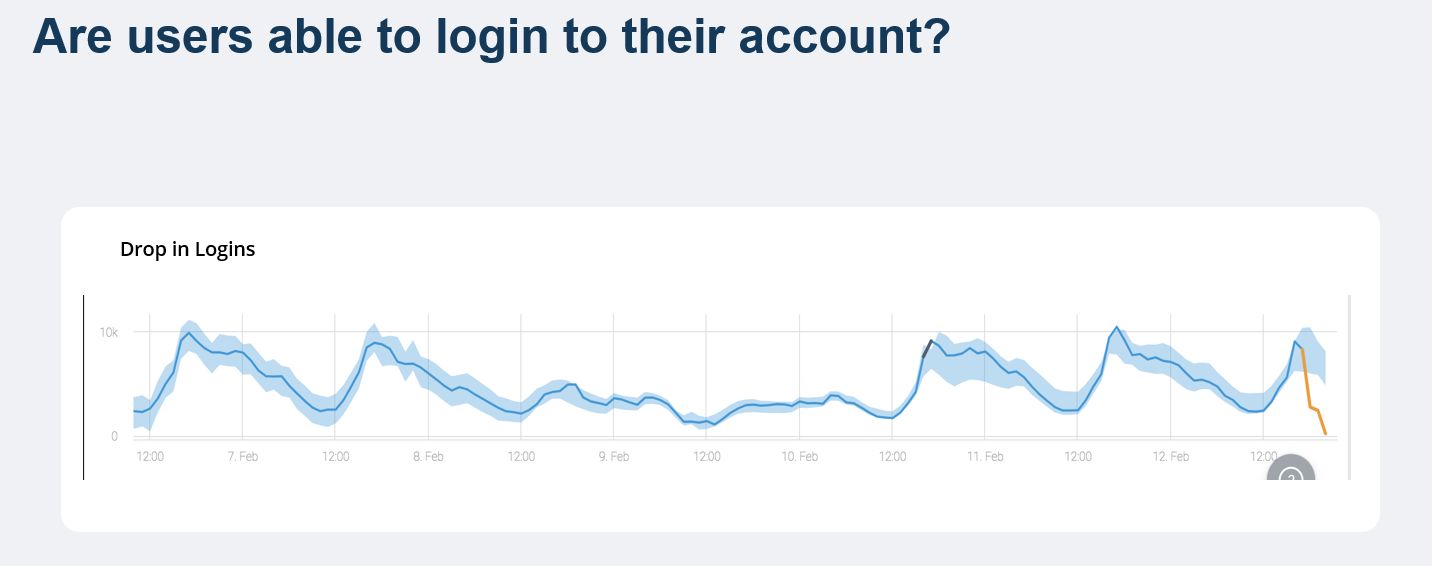
In this example, you can see how Anodot created an alert that notified the customer of a reduction in user log-ins to the app. The blue line represents the actual data, the number of log-ins to the app or website, and as you can see the orange line is the anomaly. Anodot correlated the drop in log-ins and didn’t find a corresponding drop in traffic – a situation which is usually indicative of an issue with the log-in system. With that alert, the customer quickly identified and fixed the infrastructure glitch, returning log-in rates to normal.
Drops in user log-ins potentially have a high impact on business as they are directly correlated with lost revenues, and also result in increased churn rates.
This incident underlines the importance of having a system that correlates different issues, happening across layers of the app, to a single incident.
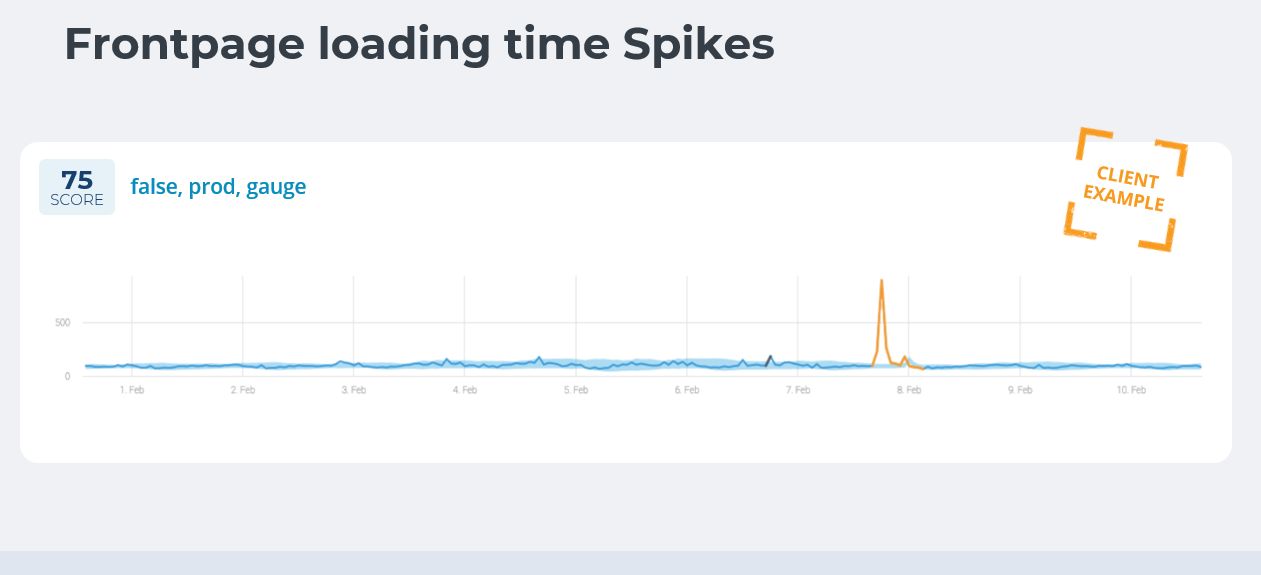
An eCommerce company experienced a spike in front-page load time because of a glitch due to a new website version deployment.
The spike in load time negatively affected their bottom line: because of the long waiting time users couldn’t browse products, add to cart, or complete any purchases, and abandoned the website.
This is an example of how real time monitoring, able by using AI and machine learning, significantly reduce potential damage. Anodot was able to cut the time to detection and alerted the customer about the issue (within 15 minutes) before other trailing indicators popped up. After receiving that alert, the client was able to mitigate the issue much faster, they checked their website version deployments and quickly installed a hotfix.
Ready to Automate? Consider Anodot.
Anodot improves customer experience analytics by reducing noise, false positives, and ultimately eliminating alert fatigue, as you’re only alerted with the anomalies that matter.
By monitoring the most granular metrics of the customer experience and identifying their correlation to each other, Anodot enables marketers and product managers to optimize human interaction across multiple touch-points.
In summary, our automated, intelligent approach to customer experience monitoring is helping online businesses score higher conversions, increase customer loyalty, and protect against loss. Interested in seeing Anodot at work on your data? Let’s talk.


