
Businesses are flooded with constantly changing thresholds brought on by seasonality, special promotions and changes in consumer habits. Manual monitoring with static thresholds can’t account for events that do not occur in a regularly timed pattern. That’s why historical context of influencing events is critical in preventing false positives, wasted resources and disappointed customers.
Typically, when forecasting a metric’s future values, its past values are used to learn patterns of behavior. However, in many cases, it is not possible to produce accurate forecasts without additional knowledge about what influences a metric’s behavior. Specifically, the observed patterns in the metric are often influenced by special events that are known to occur at specific times, both in the past and the future.
What is an Event?
An event is a special occurrence in time that is known in advance of it happening. An event recurs in the lifecycle of a metric but not necessarily on a regular basis or cadence. This is better explained with a few examples:
- Holidays that aren’t a fixed date but rather are dependent on a time of the month or year. Consider the U.S. observation of Thanksgiving, which is always the fourth Thursday of November; the Jewish observation of Hanukkah, which may occur at any time from late November to late December; or the Muslim observation of Eid al-Fitr, whose date of celebration is dependent on the cycle of the moon.
- Sales and marketing events that are often tied to a season or special celebration. Examples would be the Black Friday shopping day(s) that follow the U.S. Thanksgiving holiday; Back to School sales; post-holiday clearance sales; or Amazon’s annual “Prime Day” sale.
- Sporting events, which may be local or regional. For example, both the Super Bowl and the World Cup have a big effect on sales of beer and snack foods, attendance at sports bars, and sales of team merchandise. In a more local case, regional sporting events can have a similar effect.
- Other examples of events include weather (blizzard days, heavy rains, hurricanes, etc.); financial events (earnings releases, bank holidays, changes in interest rates, etc.); and technical events (deployment of new software version, hardware upgrades, etc.).
These events are generally known (or at least can be anticipated) in advance. Even weather predictions have become accurate enough to know when significant weather events are going to happen in a particular locale.
In the context of a machine learning (ML) based business monitoring system, events are useful in two ways:
- Understanding why an incident occurred for the purpose of root cause analysis (e.g., the increase in app crashes occurred right after a new version release indicates that a bug in the new version caused the errors).
- To improve the accuracy of the ML based monitoring. By taking into account the expected influence of an event on the metrics being monitored, you can avoid false positives, reduce false negatives, and improve forecasting accuracy.
What is an Influencing Event?
An influencing event is an event that has predictable and measurable impact on a metric behavior when it occurs. For example, Cyber Monday is an influencing event on metrics that measure revenues for many e-commerce companies in the U.S. The impact of that event is almost universally a dramatic increase in revenues during the event.
If a machine learning business monitoring system does not consider the influence of such an event on the revenue metrics of an e-commerce company, the spike in revenues would appear to be an anomaly, and a false positive alert might be sent. On the other hand, when the influence of the event is accounted for, it can help identify real anomalies.
For example, if this year’s revenue on Cyber Monday is lower than the expectation learned by the system, an alert highlighting a drop in expected revenues will be sent, ideally in real time, so remediation actions can be taken to bring it back to the expected levels of revenue.
An influencing event can impact the baseline of a metric before, during and after the event takes place. To understand the logic of that statement, consider this example:
Christmas is an annual event. Depending on the metrics you are monitoring, this event has multiple effects, both good and bad, that happen before Christmas Day, on Christmas Day, and after Christmas Day has passed.
- For merchants measuring revenue from sales, the days before Christmas are spike days. Christmas Day itself is a slow sales day for those merchants who are open for business. The days immediately following Christmas Day can see spiking sales again as shoppers look for post-holiday bargains.
- For rideshare companies, there can be an uptick in riders before the holiday as people socialize and get out and about, but Christmas Day is a drop day as people tend to stay at home that day.
Sample Patterns in a Real Business Scenario
There is a computer gaming company that occasionally runs events (called “quests”) to stimulate interest in the game. Quests happen multiple times per month at irregular intervals and each quest spans several days. For example, a quest might run for five days and be done, and the next one starts in ten days, and the one after that starts 15 days after the second quest ends.
An object of the game is to collect “coins” and the total coin count is one of the metrics the company measures. During a quest, the coin count has an interesting pattern: high on the first few days of the quest, then a smaller spike, and then returning to a normal steady pattern at the end of the quest. It looks something like this:
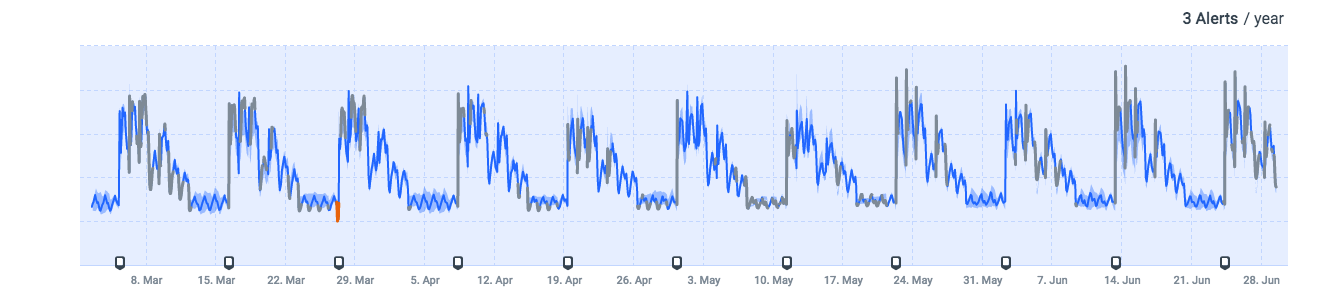
The gaming company wants to monitor the coin counts during a quest to learn if there is anything unusual happening with the game. For example, if coin counts are down considerably from the normal usage pattern, it could mean that gamers are having trouble logging into the game. That would certainly be something to look into and remedy as soon as possible. This is why anomaly detection and alerting are so important.
In the scheme of machine learning and anomaly detection, these quests are influencing events that occur at irregular times. We can’t apply a seasonality model to the machine learning process because the quests aren’t seasonal; nor are they completely random.
They are irregular, but important, nonetheless. If the machine learning took place without consideration for the influencing events, the forecast of the coin counts compared to the actual coin counts would look something like the graph below. The shaded area represents the forecasted (baseline) range and the solid line is the actual data.
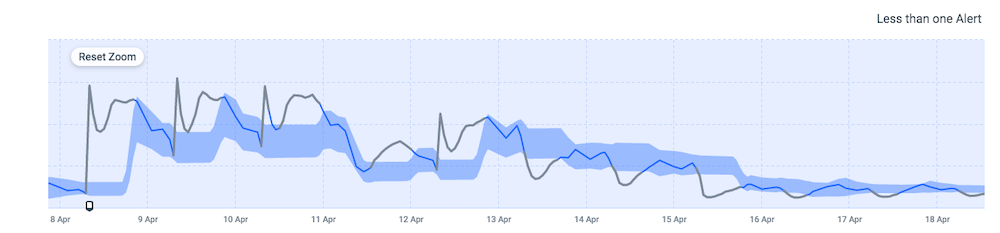
It’s a very inaccurate forecast, to say the least. There are many false positives in the timeline, and if a real issue with the game occurred during this period, it would not be detected as an anomaly.
However, if the ML model were to be told when a quest is going to start – after all, quests are scheduled, not impromptu – the model could learn the pattern of the event. The baseline could learn the pattern and it could be taken into account each time there is another quest. The resulting forecast versus actual looks something like this:
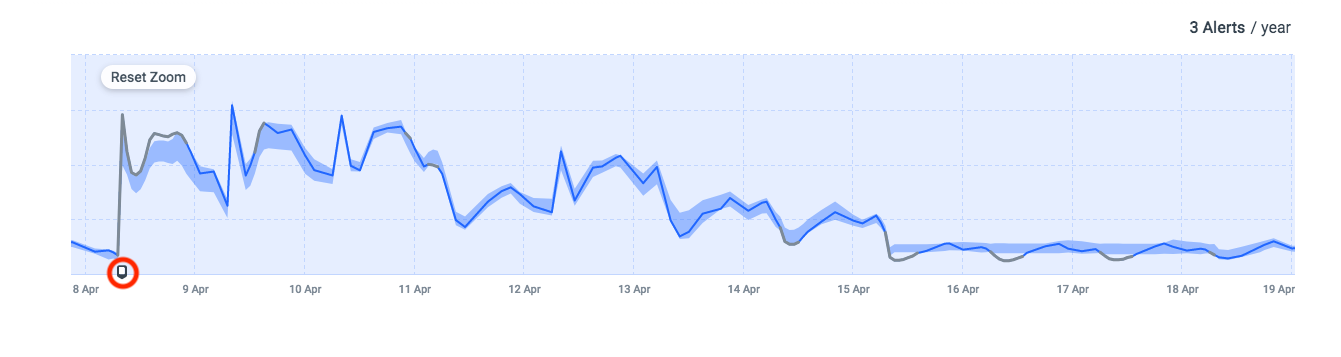
You can see the forecast is much more accurate, even with a very complicated pattern.
Take note of the small square marker (circled in red) at the bottom left of the graph. This is the indicator that tells the model a quest is starting. When this marker is sent before the start of a quest, the forecast algorithm understands how to treat the data coming in because it has seen this pattern before. In mathematical terms, the influencing event is called a regressor, and it’s critical to incorporate it into the forecast algorithm to ensure better accuracy.
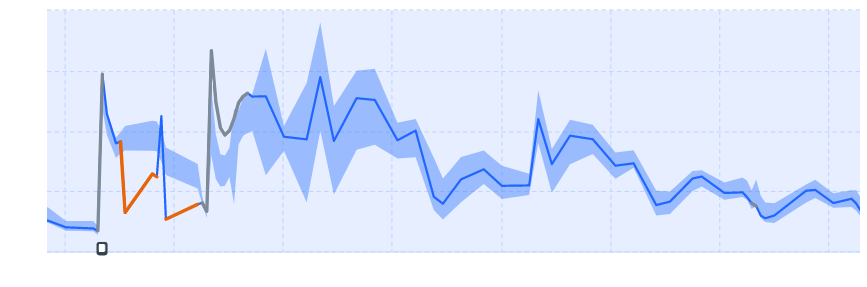
The example below shows a real issue that happened during a quest. Because the baseline was accurate, the drop in activity was detected and the issue was quickly fixed to get the game up and running as normal.
Challenges of Learning the Impact of Influencing Events
You can see just how important it is for accuracy that a model learn the impact of an influencing event. This is far easier said than done. There are some relatively difficult challenges in having the mathematical model accurately and automatically learn the impact of influencing events. The three main challenges are:
1. Being able to automatically identify if a group of historical events has any influence on a given time series
To a ML model, it’s not inherently apparent if a group of events – like Black Friday occurring over a period of years, or the gaming company’s quests over the span of a year – has an actual impact on the metrics. The first part of the challenge is to figure out if that group of events does have an impact. The second part is, if the group of events is shown to have an influence, how can occurrences of the events be automatically identified without human intervention?
For example, with the gaming company, it’s measuring many other metrics besides the coin count, so how can you tell if it is indeed the quest that has an influence on the coin count and not something else? And how can this be recognized automatically?
2. If the group does have an influence, being able to identify accurately and robustly the pattern of the influence, both before and after the event date
So you’ve determined that the group of events has an influence on the metric’s pattern. An event has a pattern, and the challenge is to learn this pattern robustly and accurately. There are two main factors making it hard:
Separating the event effect from the normal pattern: The pattern of the event needs to be separated from the normal pattern of the metric occurring at the same time – e.g., a metric measuring viewership during an event like the Superbowl is composed of the normal viewership pattern and the added viewership due to the Superbowl itself. To accurately and robustly learn the pattern of influence of the event, applications of techniques such as blind source separation are required – and the assumptions behind those techniques require validation during the learning process.
Causal and non-causal effects: A complication is that sometimes there is an impact even before the event starts. You can’t assume the impact of an event will start just when the event starts
3. Given a set of many events, automatically group them to multiple groups of events, where each group has a similar influence pattern and a clear mechanism for identifying from the event description to which group it belongs
All sorts of groups of events can have an influencing event on a particular metric. Sometimes different events can have an almost identical pattern. If these events can be grouped together, the learning of the pattern and its impact can be faster and easier.
Say you are measuring revenue for a rideshare company. This company sees spikes on New Year’s Eve in all major cities and on St. Patrick’s Day in New York and Boston because people like to go out to celebrate these days. The patterns of ridership for these events are almost identical. When you have lots of these types of events with similar patterns, you want to group them because that makes learning about them more accurate. What’s more, the groupings provide more data samples so you can do with less time in history to learn the pattern.
Despite the challenges highlighted above, being able to automatically include influencing events in the machine learning model is critically important for two key reasons. First, it reduces the generation of false positive alerts, and second, it enables capturing when a special event you are running is not acting as normal. Consider an e-commerce company whose Black Friday sale event has lower sales than expected. By incorporating this influencing event in the ML model, the merchant can see that sales are off for some reason and can begin investigation of the cause before revenues are significantly impacted.


