An emerging field of data science uses time series metrics to develop an educated estimate of future developments in business such as revenue, sales, and demand for resources and product deliverables. A forecast is based on historical data of a given metric plus other relevant factors. Accurate forecasts are an important aspect of corporate planning. They allow the organization to budget its funds and allocate its resources efficiently, and they enable decisions such as what strategies to adopt for growth.
There might be hundreds to millions of metrics and events that help forecast what can be expected in the future vis-à-vis what has happened in the past. Machine learning (ML) applied to time series data is an efficient and effective way to analyze the data, apply a forecasting algorithm, and derive an accurate forecast.
Anodot’s team has mastered the enormously complex challenge of “productizing” the process of ML-based forecasting such that an end user need not do anything more than point to his time series data source(s) and specify the forecasting parameters in order to forecast growth or demand.
An ML-based forecasting system has many benefits—the most important of which are accuracy of the forecast and the ability to scale. Moreover, the forecast models are persistent so that they can be used continuously or repeatedly on demand.
There can be challenges as well, such as not having enough data to adequately train the forecasting models or having an abundance of factors that need to be tested for relevance to making a forecast more accurate. These challenges can be addressed through various design principles, as discussed below.

The Blueprint for an ML-Based Forecasting System
Each metric that a company wants to forecast must go through a process to ultimately get to a customized forecast model that can be run again and again or even continuously. The process is depicted in the illustration in Figure 1. This is, essentially, the blueprint for creating a time series forecast.
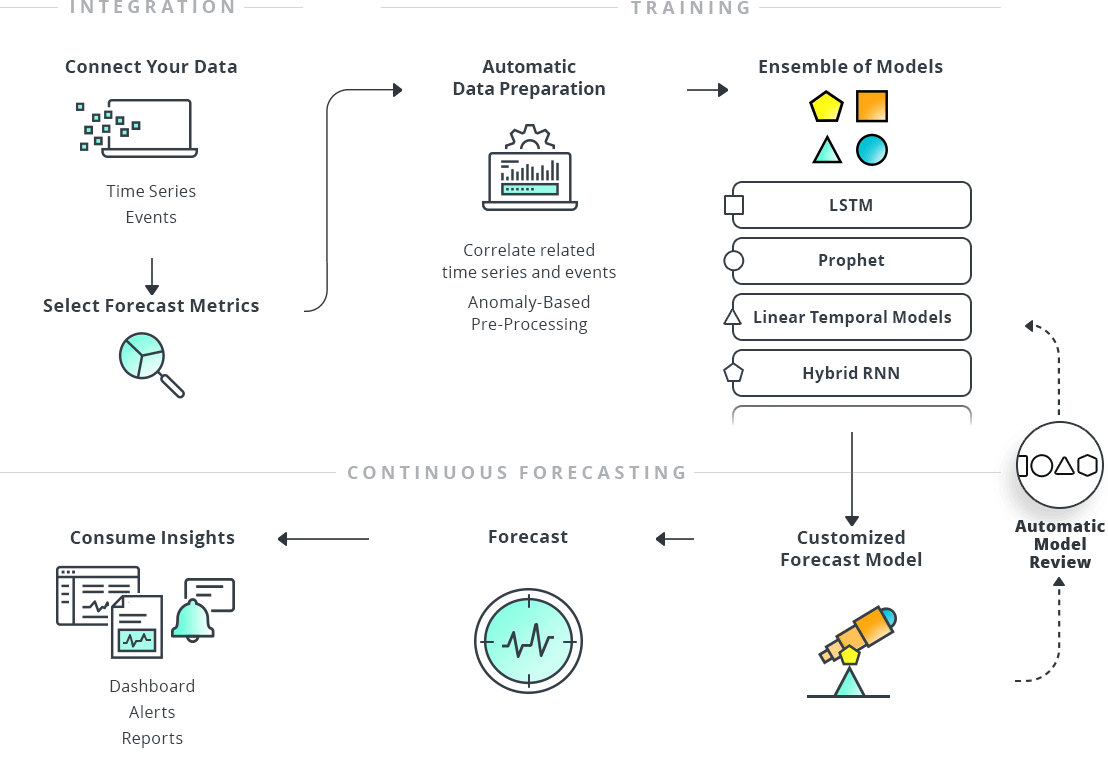
Figure 1: The Process of Building and Using a ML-Based Customized Forecast Model
Generically speaking, the components of a machine learning-based forecasting system will do the following:
-
-
- Connect the data – choose internal data to use, plus external data and/or events, if desired
- Select the forecast metrics – specify what to forecast, over what time period
- Do automatic data preparation – correlate the data sets, look for anomalies that can affect the forecast
- Train the machine learning models – use a variety of algorithms to derive a forecast and then test for accuracy, select the best models for the use case
- Create a customized model – using an ensemble of models, create a persistent model that can be used to forecast the metric on demand or continuously
- Review the customized model – conduct frequent reviews of the custom model to ensure it is optimized
- Make a forecast – using the customized model, create an actual forecast either on demand or continuously
- Consume the forecast insights – send output of the forecasting process to a dashboard, reports, alerts, or to other information systems
-
Design Principles
The most important aspect of forecasting is accuracy. There are many design principles that can help a machine learning-based forecasting system be more accurate, including the following:
Relevant Data: Metrics and Events – Machine learning models (algorithms) are trained based on historical data. Algorithms can take in as inputs the time series that is being forecast, as well as other internal or external data or events that might be significant in forecasting that time series. For an event to be statistically significant, the algorithm must see it at least several times and be aware that it is an impactful event. The more times the algorithm sees the event, the more confidence in saying what will probably happen in the future when this event happens again.
A company knows that certain events are going to happen because it is in control of them, like an internal marketing campaign, or the events are well known, like Black Friday or holidays. There are events that can’t be anticipated and nobody knows they will happen until they do, like a network outage. All these factors can impact a forecast and they must be considered when training the forecast model.
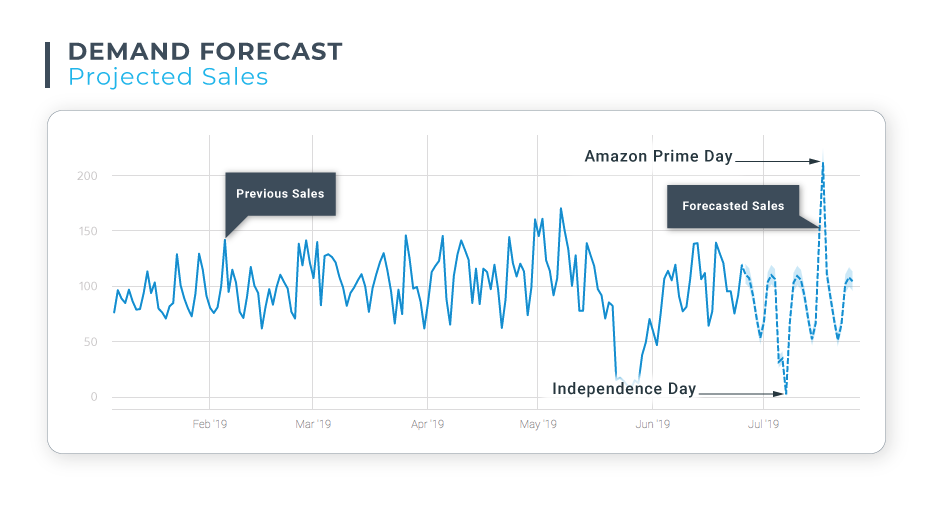
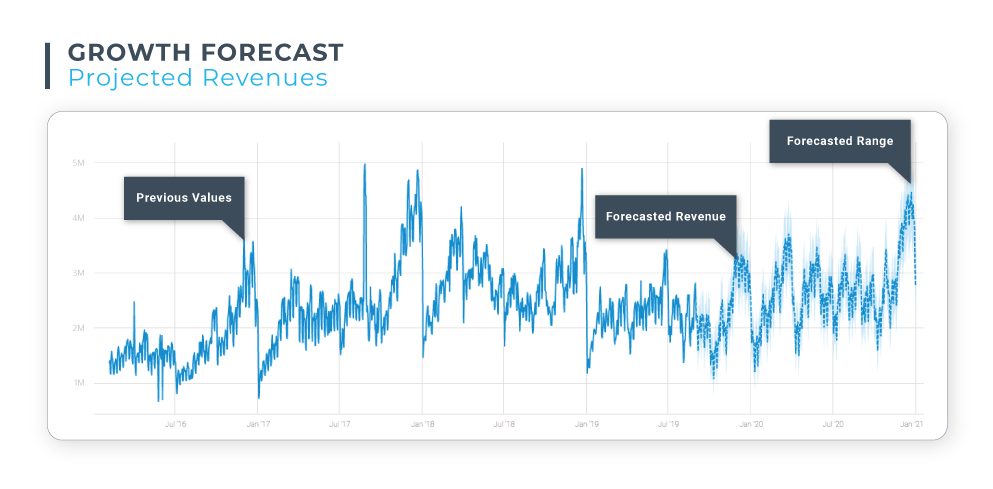
Demand Forecast: Anodot generated this forecast for a U.S.-based eCommerce customer, projecting the anticipated sales of a product for the following month. The forecasted dip in sales coincides with the Independence Day holiday weekend. A peak in sales in mid-July coincides with Amazon Prime Day, as a significant portion of this e-tailer’s business is offered on Amazon Marketplace.
Testing the Accuracy of a Forecasting Model – Accuracy is tested by taking the available historical data and splitting it into two parts, using the first part as the training data and the remaining part as the validation data. The model is trained with only the first (usually larger) portion of data and then the model is used to predict the future. This prediction is compared to the validation data, which was held back from the training process. Then we measure the error—how close the prediction came to the actual numbers. The smaller the error value (expressed as a percentage), the more accurate the forecast model.
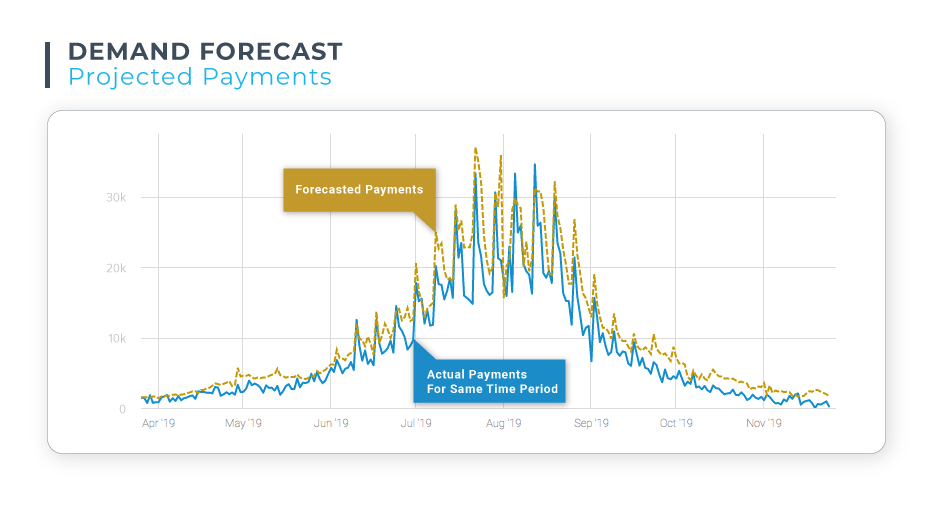
Demand Forecast: This graph compares a forecast for anticipated payments with actual payment requests for a fintech company. Comparing forecasts with actual values is a useful tool for evaluating the accuracy of your forecasting model. In this case, notice how the forecast values are higher than the actual values – in the case of demand, forecast models will typically inflate the anticipated values in order to ensure need is sufficiently met.
Determining Relevant Influencing Factors – Theoretically, there could be a million things that might influence a forecast, but inputting too many irrelevant factors causes difficulty in the model training process. When models in training are presented with a lot of dimensions and a lot of potential factors, they can encounter the Curse of Dimensionality, which says that as we have a finite amount of training data and we add more dimensions to that data, we start having diminishing returns in terms of accuracy.
Anodot adds a single dimension to the learning data and then trains the model and measures the error. We look at the factors one by one instead of looking at them all together, and we discard the factors that seem to have no influence on the dataset we are trying to forecast. This process is an efficient way to discover the factors that might have the most impact on the forecast without hitting the Curse of Dimensionality.
Using Locality Sensitive Hashing to Increase Efficiency – Anodot uses Locality Sensitive Hashing, which helps in determining if there is a correlation between the target and the measurement time series. This approach takes each time series by itself and creates a computation on it to derive a single value—a hash. If we compute the hash for two different time series and the hash values are numerically close to each other, we assume that the series are somehow correlated. This approach quickly prunes out the factors that are probably not similar. If we are comparing millions to the time series we want to forecast, we can probably prune out 99% of them very quickly. Then we are left with the remaining 1% of the factors where we can go ahead and do an exact computation to make sure that they are really close.
Working with Seasonal Data Patterns – If there is seasonality in time series data, multiple cycles that include that seasonal pattern are required to make a proper forecast. Otherwise, there is no way for the model to learn the pattern. But it’s not just about having enough training data that has multiple instances of the seasonal pattern. It also impacts the settings of the learning algorithms being used. For example, a deep learning algorithm known as LSTM would produce an accurate forecast if one of its parameters (called “lookback”) is set to be larger than or equal to the length of seasonal pattern, and very poor results if not. Another well-known classical forecasting algorithm, ARIMA, also requires knowledge of the seasonal pattern length in order to account for it in the estimated forecasting model. Without this knowledge, an ARIMA model may produce very poor results.
Identifying and Accounting for Data Anomalies – Anomalies, by definition, are things that we can’t forecast. When we give machine learning models historical data to train from, there may be anomalies in that data. If the forecasting models train without taking anomalies into account in some meaningful way, the accuracy of these forecasting models can be hurt in a dramatic way. So, we have to get clever in how to treat the anomalies.
First we must go through the historical data and discover any anomalies, and then we can decide how to handle them. We can look through external data for influencing events or measurements, or some pattern that can potentially explain the anomalous data, such as unusual weather. Another option is to make the forecast operational by continuously forecasting. Or, we can forecast with the potential of something happening by designing the system such that it doesn’t completely ignore the anomaly. Done right, we get very accurate results, and that’s the point of forecasting.
Creating an Ensemble of Models – A lot of different algorithms were designed for time series forecasting and there isn’t any specific one that is “always the best.” They all have a different mathematical way to describe the data. We take an ensemble approach with the algorithms. Ensembling the models is the way to get the best, most accurate model. It’s like taking advice from numerous experts, weighing the value of each piece of advice, and making a well-considered decision.
Identifying and Accounting for Different Times Series Behavior – If we have multiple time series, it might be possible to train one model that will learn all the patterns, allowing us to get by with having less history even though it’s not that same time series. For any given time series, we don’t have an infinite history, but now we have a lot of time series that may allow us to learn the patterns of all of them together. The central question becomes whether we can take a lot of them together and train one forecasting model that can be accurate for each one of them individually, while not having infinite history for any one of them. For this we must consider all forms of time series behavior, including things like seasonality and data trends.
There are two main factors that we found to have relevance. If two time series are different in those factors, we cannot train models together with them. The first is seasonal effect. If two time series have very different seasonal patterns, and very different strength for a seasonal pattern in terms of season length, then we cannot train them together. The second is homoscedasticity, which has to do with the variability of the noise level of the data. For all other factors we tested, we can probably put them together and not worry about that single model being less accurate.
The Human Element of Forecasting – There’s one exception to the rule of “accuracy is critical” and that is when the human element – CEOs, CFOs, business managers – intentionally wants to introduce a business-driven bias into the forecast. The CFO wants a growth forecast that is slightly less optimistic than reality to ensure the company stays within its budget. The store manager wants his demand forecast to be slightly more optimistic to ensure that inventory is sufficient to cover customer demand. Anodot’s system can consider those biases to build in a small percentage of error to deliver the right type of forecast for the business use case.
An Overview of the System Architecture
Building the underlying infrastructure that can support an autonomous forecasting system is no trivial matter. There are many ways that a technical team can approach building a system that essentially “productizes” the generation of accurate forecasts. Our team laid out a system architecture and technical components that have resulted in the SaaS-based turnkey forecasting solution known as Anodot Autonomous Forecast.
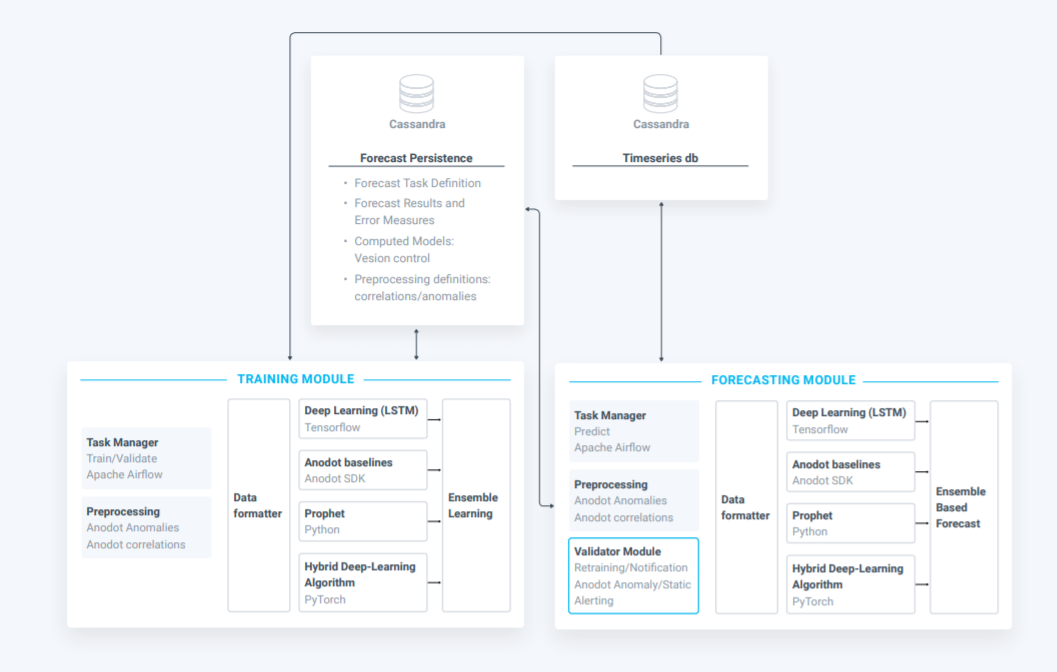
There are three main components of our system. The persistency layer is comprised of the data stores where data, models and other pertinent details are kept. The training module is where we train the forecasting models. The forecasting module is the part that continuously forecasts the desired metric.
The Data Store – One part of the data store collects and stores the actual data that is to be forecast, along with all the supporting data that will help with the forecast. Another part is for persisting the models themselves. When we train a model, we want to persist that description of the model, the forecast tasks and their definition, the results and error messages, and the models themselves with version control around them. We also want to persist any type of definitions we had around correlations and how to handle anomalies. This persistence layer is very important in order to keep everything in a way such that it can be retrieved, debugged, perfected and used again. The ability to do this distinguishes a forecasting system from a one-time approach to forecasting where little is preserved for re-use. We use a Cassandra database for this component.
The Training Module – Training a model entails a lot of pre-processing steps and thus requires a task manager component. Apache Airflow allows us to predefine all the different parts of the workflow of what it takes to train the model itself, including discovering anomalies in the data and preparing the data for the different types of algorithms. Then the task manager orchestrates training a variety of models. Kubernetes manages the physical aspect of spinning up and down the necessary servers to perform the various training tasks.
There are different technologies associated with different algorithms: a version of LSTM is implemented in TensorFlow; Prophet is in Python; yet another algorithm is in PyTorch. We have to combine a lot of different technologies coming from different sources, automate the process of spinning them up, running them, taking their output, storing it, then grouping it together with a consistent view. There’s a lot of engineering work involved in getting this to work in the click of a button.
The Forecasting Module – This module has to figure out the forecasting task related to the data it is given. We load all the models that were chosen in the training phase into memory. We do any pre-processing that would pre-define on that data the correlated metrics, the correlated events, and we find the anomalies in this new data. Then we push the new data into all these models and let them forecast. Once the forecast is done, we store the forecast back into the time series database, compute the error that we had from the last time we had data, and store that error into the forecasting persistency.
What It Takes to Build This System
It takes a multi-disciplinary team of experts to design and build this type of system. The team needs data scientists that understand series analysis and forecasting. Even though the forecasting algorithms are generally well known, getting them to work correctly with time series data is not trivial. Using linear models takes another set of skills. Building a system such as this takes a data science team that deeply understands time series analysis and that has a working knowledge about all the different types of models that are out there.
The team also includes software engineers that help set up the automation of all these processes, a user interface (UI) team, and a DevOps team that helps automate the coding part of it and the deployment of all these components. The team needs people who can work with the databases, the back-end systems, orchestration, and all the automation aspects.
As for the time to develop this type of system, it’s probably a year or more, plus additional time for research preceding the development effort.
Read All the Details
To get all the details about the pillars of creating a machine learning-based forecasting system, read our three-part series, “The Essential Guide to Time Series Forecasting”:
Written by Ira Cohen
You'll believe it when you see it


