
A Quick Guide to the Different Types of Outliers
The only way to succeed in today’s rapidly changing economy is through business agility — making the right decisions at the right time. Companies generate more data points than ever before, but decision-making requires more than data. Business leaders need actionable insights in real time to keep up with the speed of change in the modern marketplace.
They say no one can predict the future, but outliers in business data can act as markers for future opportunities and risks.
Outlier detection can help you chart a better course for your company as storms approach or the business currents shift in your favor. With rapid detection and contextual analysis, leaders can adjust course in time to generate revenue or avoid losses. Here is a look at outliers and their main types.
In this article:
- The 3 Different Types of Outliers
- Think of it This Way
- The Limitations of Manual Outlier Detection
- How Anodot Approaches Outlier Analysis
The 3 Different Types of Outliers
In statistics and data science, there are three generally accepted categories which all outliers fall into:
- Type 1: Global Outliers (aka Point Anomalies)
- Type 2: Contextual Outliers (aka Conditional Anomalies)
- Type 3: Collective Outliers
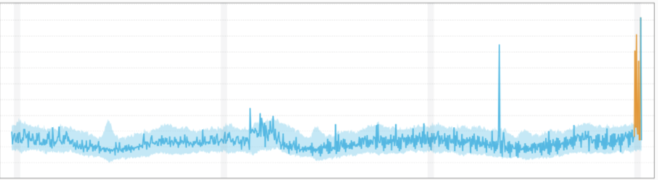
Type 1: Global Outliers
A data point is considered a global outlier if its value is far outside the entirety of the data set in which it is found (similar to how “global variables” in a computer program can be accessed by any function in the program).
Global Anomaly:
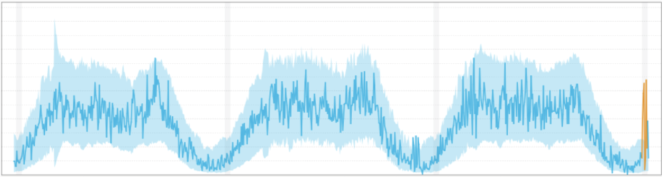
Type 2: Contextual (Conditional) Outliers
Contextual outliers are data points whose value significantly deviates from other data within the same context. The “context” is almost always temporal in time-series data, such as records of a specific quantity over time.
Contextual Anomaly
Values are not outside the normal global range, but are abnormal compared to the seasonal pattern.
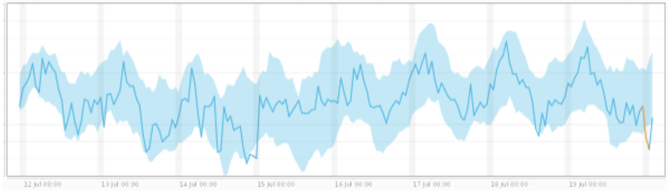
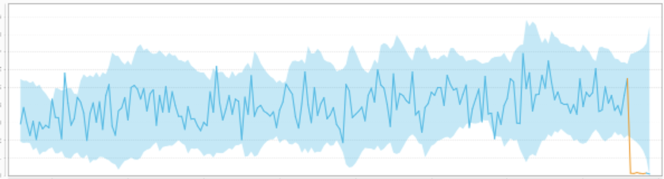
Type 3: Collective Outliers
A subset of data points within a data set is considered anomalous if those values as a collection deviate significantly from the entire data set, but the values of the individual data points are not themselves anomalous in either a contextual or global sense. In time series data, one way this can manifest is as normal peaks and valleys occurring outside of a time frame when that seasonal sequence is normal or as a combination of time series that is in an outlier state as a group.
Collective Anomaly
We combined two related time series into a single anomaly in this example. The individual behavior does not deviate significantly from the normal range for each time series but shows a more significant deviation when combined.
Think of it This Way
A plane landing on a highway is a global outlier because it’s a truly rare event that a plane would have to land there. If the highway was congested with traffic that would be a contextual outlier if it was happening at 3 a.m. when traffic doesn’t usually start until later in the morning when people are heading to work. And if every car on the freeway was moving to the left lane at the same time that would be a collective outlier because although it’s definitely not rare that people move to the left lane, it is unusual that all cars would relocate at the same exact time.
These analogies can help in understanding the basic differences between the three types of outliers, but how does this fit in with time series data of business metrics?
Let’s move on to examples which are more specific to business:
A banking customer who normally deposits no more than $1000 a month in checks at a local ATM suddenly makes two cash deposits of $5000 each in the span of two weeks is a global anomaly because this event has never before occurred in this customer’s history. The time series data of their weekly deposits would show an abrupt recent spike. Such a drastic change would raise alarms as these large deposits could imply illicit commerce or money laundering.
A sudden surge in order volume at an eCommerce company, as seen in that company’s hourly total orders for example, could be a contextual outlier if this high volume occurs outside of a known promotional discount or high volume period like Black Friday. Could this stampede be due to a pricing glitch which is allowing customers to pay pennies on the dollar for a product?
A publicly traded company’s stock is never a static thing, even when prices are relatively stable and there isn’t an overall trend, and there are minute fluctuations over time. If the stock price remained at exactly the same price (to the penny) for an extended period of time, then that would be a collective outlier. In fact, this very thing occurred to not one, but several tech companies on July 3 of this year on the Nasdaq exchange when the stock prices for several companies – including tech giants Apple and Microsoft – were listed as $123.45.
The Limitations of Manual Outlier Detection
Businesses today manage millions of data points potentially relevant to their KPIs, along with multiple types of outliers to consider and evaluate. Whether an outlier indicates an opportunity or a problem, reaction speed is critical to achieving positive results in the face of uncertainty. Something as simple as one API losing service could cause a business to lose money every second. Reducing the time between occurrence and discovery can buy a company critical time to roll back an update and restore revenue flow.
Looking for unusual data points by manually examining every metric, however, is impractical for more than a few dozen metrics. In addition, manually monitoring dashboards and alerts in traditional BI tools doesn’t provide the real-time insight organizations need to stay ahead of problems before they become too costly and damaging.
Manual detection is insufficient even when the outlier represents an opportunity rather than a problem. For example, an unusual uptick in users or purchases from a specific geographical area may be due to a successful social media marketing campaign that has gone viral in that region. Given the short lifespan of such surges, your business has a limited time window to capitalize and transform that engagement into logins and sales.
How Anodot Approaches Outlier Analysis
Regardless of industry, no matter the data source, the outlier detection capabilities of Anodot’s system can find all types of outliers in time series data, in real-time, and at the scale of millions of metrics.
A data-agnostic solution, Anodot uses machine learning algorithms and outlier detection capabilities to spot anomalies in time series data.
Although explaining the math, software and algorithms in detail would require a more extensive technical explanation (see our 3-part white paper on outlier detection), below we’ve outlined the key steps in accurately detecting outliers:
- Choosing the most appropriate model and distribution for each time series: This is a critical step to detect any outlier because time series can behave in various ways (stationary, non-stationary, irregularly sampled, discrete, etc.), each requiring a different model of normal behavior with a different underlying distribution.
- Accounting for seasonal and trend patterns: contextual and collective outliers cannot be detected if seasonality and trend are not accounted for in the models describing normal behavior. Detecting both automatically is crucial for an automated anomaly detection system as the two cannot be manually defined for all data. Anodot’s solution includes a very efficient and accurate seasonality detection algorithm (called Vivaldi), and all models account for various trend changes in the data that are normal.
- Detecting collective anomalies involves understanding the relationships between different time series, and accounting for them when detecting and investigating anomalies. Anodot developed several algorithms for learning those relationships from the time series behavior, and delivers collective anomalies by combining anomalies at the single time series level to the multivariate level.
Outliers are often visible symptoms of underlying problems that you need to fix fast. Those symptoms are only as visible, however, as your outliers detection system makes them to be. Whether it’s money laundering, a pricing glitch or testing data let loose, machine learning-based anomaly detection can find the needle in a haystack of millions of metrics.
Written by Ira Cohen
Ready to see our solution in action?
Prepare to see how Anodot leverages AI to constantly monitor and correlate business performance, identify revenue-critical issues, and provide real-time alerts and forecasts.


