
In the digital age, the speed and performance of apps and websites have a huge impact on the customer experience. To ensure a high level of quality, Application Performance Monitoring (APM) refers to the process of tracking the performance and availability of software systems.
Let’s look at what Application Performance Monitoring is, how AI and machine learning are being applied to stay ahead of the competition, and several real-world use cases.
What is Application Performance Monitoring?
Application performance monitoring (APM) is the process of tracking the performance of applications and technology by detecting anomalies, identifying potential issues, and resolving them before they impact the user experience. With the increasingly complex and distributed nature of the digital economy, it’s typically required that application performance monitoring operates autonomously and can resolve incidents in near real-time.
Ultimately, the goal of monitoring application performance is to simplify the complexity of end-to-end monitoring. To do so, the entire application architecture must be monitored at a granular level, as should the business metrics that are impacted by application performance. Ideally, the system in place would identify the relationships between application performance and business metrics, as illuminating these links can facilitate root cause analysis.
Monitoring all the permutations of these metrics and the numerous ways they can influence one another is incredibly complex to do manually, which is why AI and machine learning are enabling monitoring at a scale and accuracy heretofore unseen.
AI/ML for Application Performance Monitoring
Application performance monitoring requires more granularity than traditional monitoring solutions, which typically involve setting static thresholds for known incidents and tracking performance in a dashboard. As described in Introduction to Business Monitoring, business metrics pose a unique monitoring challenge for three primary reasons:
- Context: Business metrics cannot be evaluated in absolute terms as they derive significance from their unique context
- Topology: The relationships, or topology, between metrics, are unknown due to their dynamic and volatile nature
- Volatility: Finally, business KPIs are sampled irregularly, which requires an adaptation of how data is stored and how it is metrics are analyzed
To deal with these challenges, effective application performance monitoring requires a solution that can deal with these layers of complexity in the following ways:
- 100% of the granular data must be monitored in real-time
- Each metrics unique behavior must be learned autonomously
- Each metric must be correlated with one another with a deep root cause analysis
Let’s look at how AI and machine learning can be used to handle APM in a number of real-world use cases.
Use Cases of Application Performance Monitoring
Application performance monitoring can be applied to nearly any metric that affects software performance, with several of the most common use cases being:
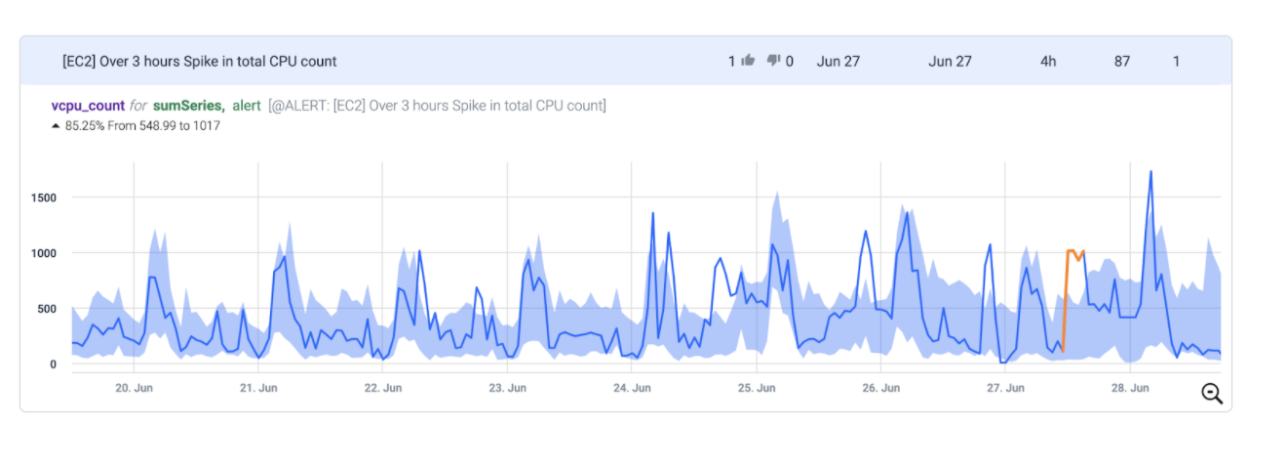
CPU Usage & Cloud Cost Monitoring
APM is commonly applied to tracking server and CPU usage to ensure spikes and anomalies don’t result in downtime for the app. In the example below, you can see an alert from an AWS EC2 service that is monitored on an hourly time frame. In this case, it was not the absolute value that was anomalous, but instead, it was the time of day. Instead of waiting until the next day, the company received a real-time alert and was able to resolve the problem before a significant cost was incurred:
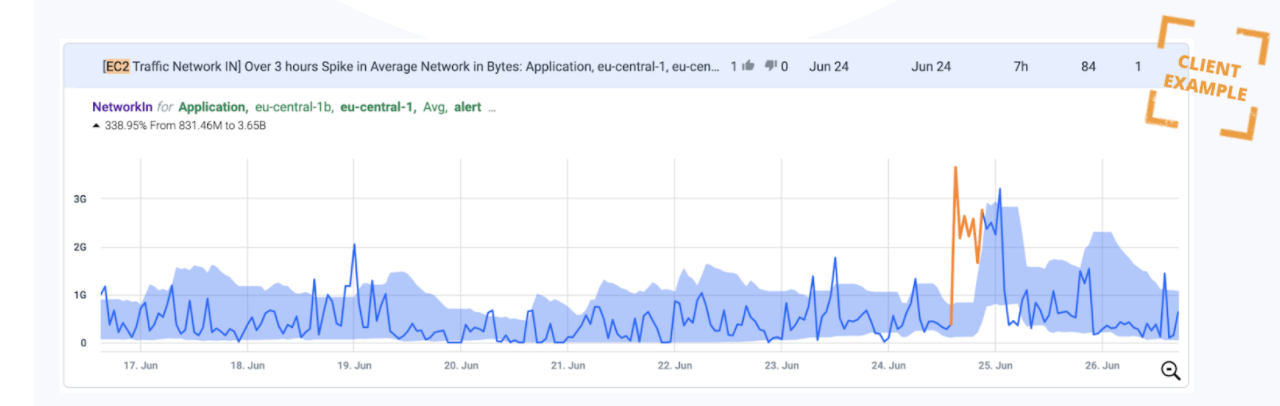
In another example discussed in our guide to cloud cost monitoring, the company experienced a 1000% spike in network traffic over a 3 hour period. Once again, if the company had been using a traditional daily cost report the spike would have not been caught until the next day. In this case, the company received a real-time alert paired with a root cause analysis resulting in significant cost savings and no app downtime:
Surge in Hourly EC2 Network Traffic
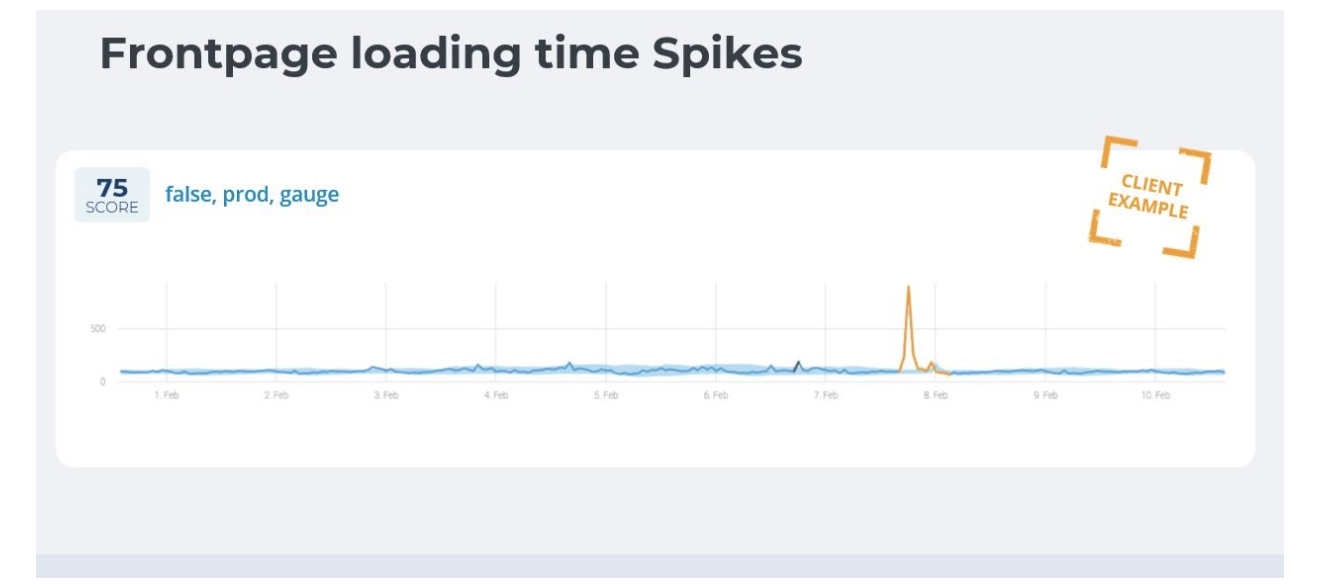
Error Rate Monitoring
With development teams pushing software updates at an increasingly faster frequency, monitoring for spikes in error rates is crucial to maintaining performance. In the example below, an eCommerce company experienced a spike in front-page load time due to a glitch in a new website version deployment. By using an AI-based APM solution, the company was alerted of the spike within 15 minutes and quickly installed a hot-fix before it negatively impacted the customer experience:
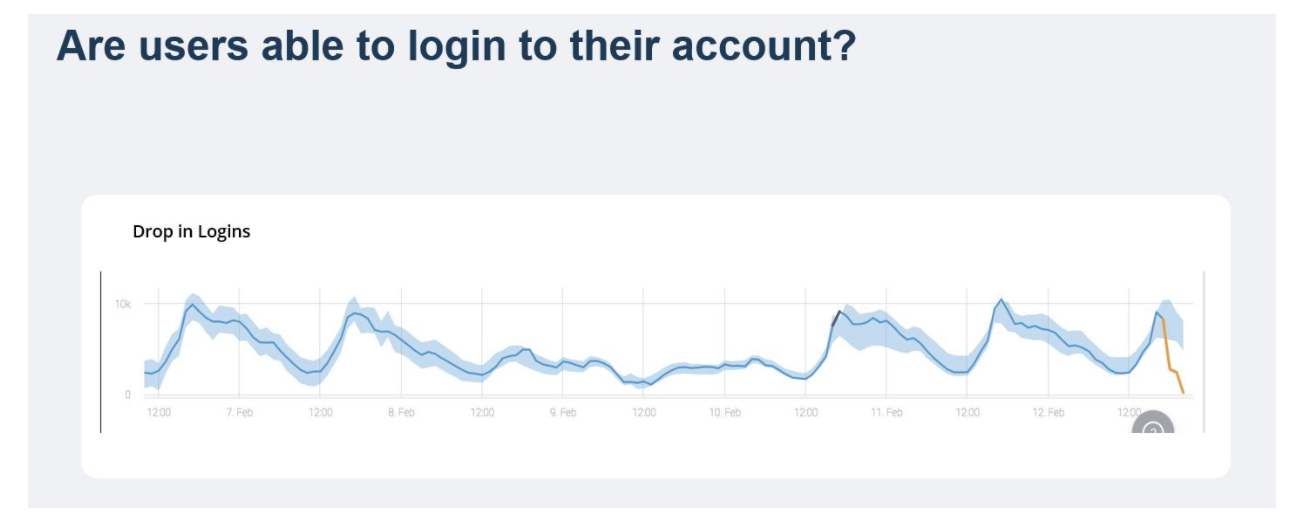
Customer Experience Monitoring
Monitoring metrics across the entire customer journey is critical to ensuring a high-quality user experience. This can include monitoring for engagement, conversion rates, logins, revenue, reputation, and more. In the example below, you can see there was a drop in the login rate highlighted in orange. This drop-in login rate was not correlated with a drop in overall traffic, indicating that there was an infrastructure glitch. In this case, the root cause analysis enabled the company to resolve the incident and return login rates before they had negatively impacted the customer experience or led to increased churn:
Summary: Application Performance Monitoring
Application performance monitoring is the process of tracking key metrics that influence an app’s performance. This can be applied to nearly any business metric as there can often be a high degree of correlation between application performance and an organization’s bottom line. The ultimate goal of this process is to detect anomalies and resolve incidents before they incur a loss.
Traditionally, many companies relied on static thresholds and dashboards for monitoring application performance, although as applications have become increasingly complex and distributed in recent years, the demands have created a strain on operations and IT teams.
To solve the challenges associated with monitoring complex applications, AI and machine learning are being applied to application performance monitoring to accelerate time and resolution, and safeguard user experience and revenues.


