
I’m a big fan of maturity models. They help teams clearly articulate their vision and define a path forward. You can tie the product roadmap and projects to the model and justify budgets needed to reach the desired maturity level.
Gartner offers the following “Analytics Spectrum” that describes how analytics platforms evolve in two main dimensions:
- Sophistication level of the analytics
- Amount of human intervention required in the decision-making process towards a desired action.
The most common form of analytics is descriptive, with few that offer some level of diagnostics. Predictive Analytics are not yet mature, but we clearly see an increasing demand for a better prediction model and for longer durations. As for prescriptive analytics — the icing on the cake — there are very few organizations that have reached that level of maturity and are applying it in very specific use cases.
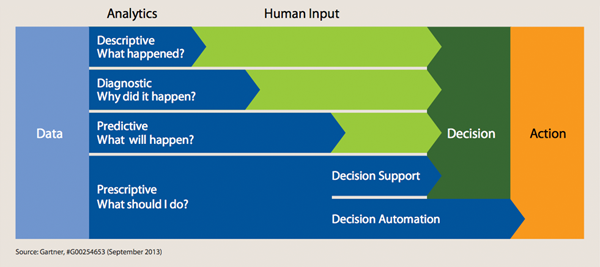
As you can imagine, at the highest maturity level, an analytics platform provides insights about what is going to happen in the future and takes automated actions to react to those predictions. For example, an e-commerce web site can increase the price of a specific product if the demand is expected to increase significantly. Additionally, if the system detects a price increase by competitors, they can send a marketing campaign to customers that are interested in that product to head off declining sales, or they can scale up or down based on changes in traffic volumes.
Taking the Gartner model into consideration, I have developed a new maturity model which takes a slightly different (but very much related) approach to help you evaluate the current state of your monitoring/analytics system and plan in which areas you want to invest. This model is to be used as a guide since each company will be at its own level of maturity for each of the monitoring system capabilities.
Moving down the left side of the table below, we see the Monitoring System Key Capabilities: Collect (business and infrastructure metrics), Detect, Alert, Triage, Remediate. The numbers from left to right are the different levels of maturity of each of these capabilities. And lastly, on the right, are the KPIs affected by each capability, that I explained in more detail in the first post of this series: TTD (Time to Detect), TTA (Time to Acknowledge), TTT (Time to Triage), TTR (Time to Recover), and SNR (Signal to Noise Ratio).
| Monitoring System Key Capability |
Maturity Level | Affected KPIs | ||||
| 1 | 2 | 3 | 4 | 5 | ||
| Collect (Business Metrics) | Key metrics at Site/Company level | Key metrics at product line, geography level | Secondary level metrics at product line, geography, customer/partner | Key and Secondary metrics at page, OS and browser level | Fine grain dimensions per transaction | TTD, TTR |
| Collect (Infrastructure Metrics) | Key metrics for key components at Site level | Key metrics for key components at availability zone/data center level | Key metrics per component in the entire technology stack (database, network, storage, compute etc.) | Key metrics per instance of each component | Fine grain dimensions per component/instance | TTD, TTR |
| Detect | Human factor (using dashboards, customer input etc.) | Static Threshold | Basic statistical methods (week over week, month over month, standard deviation), ratios between different metrics | Anomaly detection based on machine learning | Dynamic anomaly detection based on machine learning with prediction | TTD |
| Alert | Human factor (using dashboards, customer input etc.) | Alert is triggered whenever detection happens on single metric | The system can suppress alerts using de-duping, snoozing, minimum duration | Alerts simulation, enriched alert | Correlated and grouped alerts to reduce noise level and support faster triaging | SNR, TTA |
| Triage | Ad Hoc (tribal knowledge) | Initial play book for key flows | Well defined play book with set of dashboards/scripts to help identify the root cause | Set of dynamic dashboards with drill down/through capabilities and to help identify the root cause | Auto Triaging based on advanced correlations | TTT |
| Remediate | Ad Hoc | Well defined standard operating procedure (SOP), manual restore | Suggested actions for remediation, manual restore | Partial auto-remediation (scale up/down, fail over, rollback, invoke business process) | Self-Healing | TTR |
One thing to consider is that the “collect” capability refers to how much surface area is covered by the monitoring system. Due to the dynamic nature of the way we do business today, it’s kind of a moving target — new technologies are introduced, new services are being deployed, architecture change, and so on. Keep it in mind as you might want to prioritize and measure progress in the data coverage.
You can use the following spider diagram to visualize the current state vs. the desired state of the different dimensions. If you want to enter your own maturity levels and see a personalized diagram, let me know and I’ll send you an spreadsheet template to use (for free, of course).
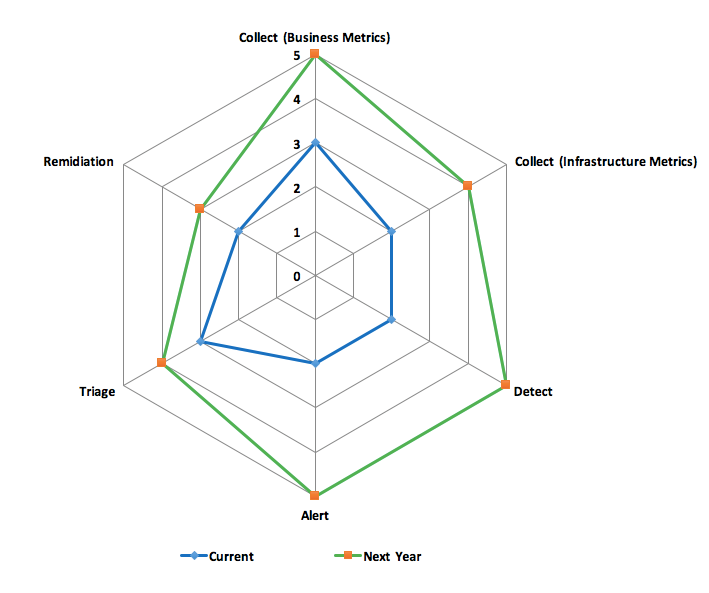 The ideal monitoring solution is completely aware of ALL components and services in the ecosystem it is monitoring and can auto-remediate issues as soon as they are detected. In other words, it is a self-healing system.
There are some organizations that have partial auto-remediation (mainly around core infrastructure components) by leveraging automation tools integrated into the monitoring solution. Obviously, to get to that level of automation requires a high level of confidence in the quality of the detection and alerting system, meaning the alerts should be very accurate with low (near zero) false positives.
When you are looking to invest in a monitoring solution, you should consider what impact it will make on the overall maturity level. Most traditional analytics solutions may have good collectors (mainly for infrastructure metrics), but may fall short when it comes to accurate detection and alerting; the inevitable result, of course, is a flood of alerts. A recent survey revealed that the top 2 monitoring challenges organizations face are: 1) quickly remediating service disruptions and 2) reducing alert noise.
The most effective way to address those challenges is by applying machine learning-based anomaly detection that can accurately detect issues before they become crises, enabling the teams to quickly resolve them and prevent them from having a significant impact on the business.