
“If you can’t measure it, you can’t improve it.” This quote by Peter Drucker and the philosophy behind it is a key driving force behind modern management and the introduction of BI solutions to support the scaling and increased complexity of businesses. Analytics tools were developed to enable metrics measurement and business monitoring across large scale, complex systems and to enable continuous improvements of business performance. Monitoring platforms are no different in the sense that they are designed to collect many data points and enable detection of issues (i.e. insights) from either system or business metrics.
Business Monitoring: Incident Life Cycle
As a rule, monitoring solutions are designed to collect data, process it and enable detection of issues through alerts or dashboards. Let’s assume your organization has already invested in a monitoring solution to improve visibility of the health of different services. Now the question is how to measure the effectiveness of this monitoring platform so you can improve it. To begin measuring this, a company must review how individual incidents are identified, handled, and resolved. Luckily, every incident has a standardized lifecycle with multiple segments:
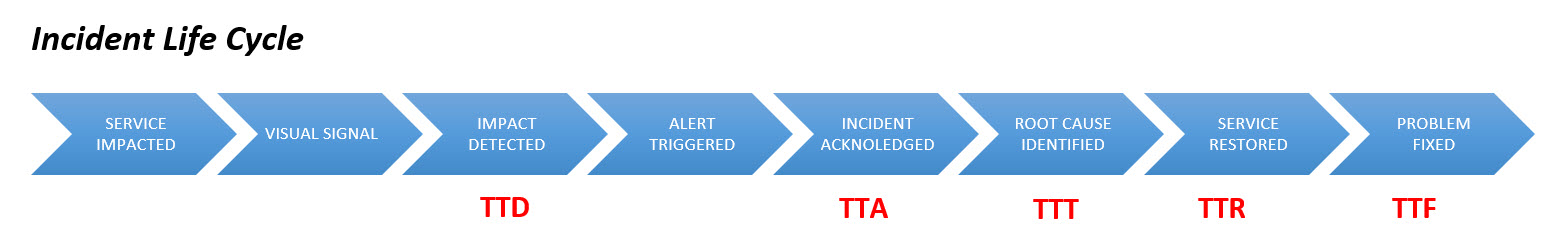
- TTD (Time to Detect) = The time it takes to detect that there is a problem, whether via visual representation on a dashboard, a customer call or an alert that was triggered.
There are several ways to detect that there has been an impact on service:
- Customer or partner lets you know – We want to avoid this scenario and be as proactive as possible. This is one of the main reasons a company invests in monitoring in the first place.
- Some metric on a graph “misbehaves” – This can be an increase in error rate, a drop in total volume, etc.
- An alert triggered by your monitoring system. Sometimes all three scenarios occur. In this case, we should capture the earliest detection time and, if possible, capture the detection source as well. Ideally, more and more of the incidents will be detected early through alerts. Some people use the same acronym for “Time to Diagnose” which includes a few more steps and a human factor. To avoid confusion, I refer to this as Time to Triage instead, and I go into more detail below.
- TTA (Time to Acknowledge) = The time it takes to acknowledge the problem. This usually translates into the time it takes to receive an alert, identify a drop/spike on the dashboard or receive a customer complaint.
- TTT (Time to Triage) = The time it takes to diagnose the problem. This is where good correlations and deep analysis can really move the needle. The more sophisticated your alerting capabilities (e.g. one that can suggest root cause), the smaller the gap will be between TTT and TTD.
- TTR (Time to Recover) = The time it takes to restore service by moving away from a broken service, switching to DR or alternative service, etc. (wiki)
- TTF (Time to Fix) = The time it takes to fix a problem. This measurement captures the amount of time that passes between when the root cause is found and completely fixed (e.g. replacing a faulty hardware component). Sometimes service can be recovered without fixing the root cause, hence the need to differentiate between TTR and TTF.
- TBF (Time Between Failures) = The elapsed time between inherent failures of a system during operation (wiki).
Obviously, collecting and analyzing more granular data throughout the incident life cycle will help us identify bottlenecks in the process and drive improvements. The reality is that most organizations don’t measure each step, and in most cases, they measure MTTD (Median Time to Detect) and MTTR (Median Time to Recover).
There are different statistical methods for analyzing data, some rely on median times (e.g. MTTD, MTTR) and some use percentile (e.g., 95 percentile). Each method has pros and cons depending on the sample size. While percentiles highlight long-lasting incidents, five long incidents at the beginning of the year can skew the KPI for the rest of the year (e.g. for a sample size of ~100 yearly incidents). Using the mean has the potential to mask some of the worst incidents as they get lost in the average.
At the end of the day, no matter how you measure the effectiveness of your business monitoring system, it is crucial to have a process in place to periodically analyze ALL incidents with TTD greater than X minutes and TTR greater than Y minutes (where X and Y are your organizational targets). As a result, you will find that there are four main gap categories:
- Missing Coverage: The failing component was not covered as part of the monitoring system. It might be that more granular data is required to detect such issues in the future.
- Missing Alerts/Dashboards: The data was available, but no alert/dashboard was set up to monitor the health of the failing component.
- Wrong Thresholds: An alert was configured, but it was configured in such a way that no alert was triggered. As most alerting systems use static thresholds, users fine-tune the threshold to keep from generating too much noise. In such cases, some real business incidents might be missed. This is a challenge which requires much more sophisticated detection mechanisms using machine learning to reduce the signal to noise ratio (SNR) and generate more reliable and actionable alerts.
- Human Factor: for various reasons the person that receives the alert or is supposed to scan the dashboard for anomalies did not pay attention to the signals.
Measuring business processes can be hard, and without having an automation process to collect data points, it will be even more challenging to capture the timestamp of each stage accurately. You will probably experience resistance from some team members that may be concerned that it reflects on their performance.
I found that the best way to drive accountability is by setting goals for the teams and individuals responsible for moving the needle on these metrics. Start by getting the basic metrics (e.g. TTD and TTR), which are easier to measure. You might not get them right the first time, but remember, this is just the start of a journey of constant improvement of your business monitoring capabilities and the way you measure its effectiveness.
Happy measuring!