
Written by @InterpretableAI & IraIraCohen
In the first four parts of our series on correlation analysis, we discussed the importance of this capability in root cause analysis in a number of business use cases, and then specifically in the context of promotional marketing, telco and algorithmic trading. In this blog we walk through how to leverage correlation analysis to address the challenges in ensuring a seamless online payment experience by the end-user. In general, digital payments include:
- Online – browser-based purchases of goods/services
- In-store – tapping mobile device at a point-of-sale/scanning a code to pay
- In-app – purchase of goods/services through an app such as features in a mobile game
- Peer-to-peer – send/receive money through a digital service/platform as exemplified by services such as Venmo, Zelle and the like
End-use of digital payment include, but not limited to, BFSI (Banking, financial services and insurance), Healthcare, IT & Telecom, Media & Entertainment, Retail & E-commerce, Transportation.
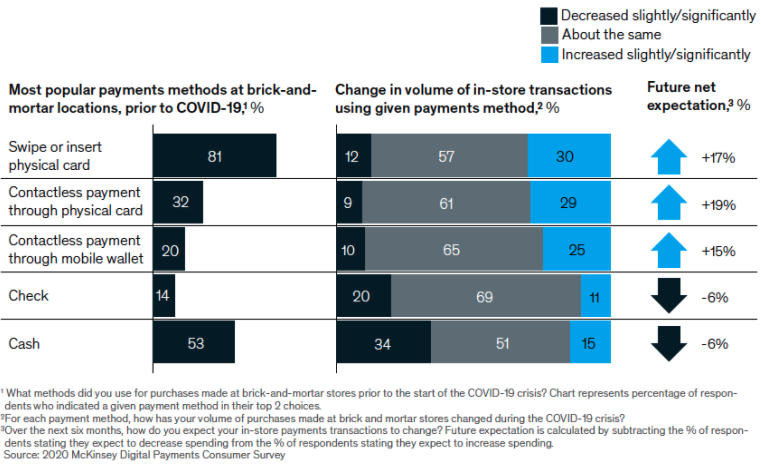
Unlike matters pertaining to maintaining corporate liquidity, cash is increasingly becoming the not preferred option in the context of consumer-to-business transactions. The COVID-19 crisis and ongoing fears of infection have prompted consumers and businesses to rely, more than ever, on digital and contactless payment options. The infographic below (from McKinsey’s report) highlights the same.
In the realm of contactless payment, biometric authentication is expected to gain momentum in the coming years. It is a verification method that involves the biological characteristics of the person. The verifications include facial recognition, fingerprinting scanning, heartbeat analysis, and vein mapping.
Since the founding of PayPal, numerous players have surfaced in the payment space, for example, but not limited to, Square, Stripe, Affirm, Venmo, Chargebee, Zelle, WhatsApp Pay, Novi. As per this whitepaper, 1.7 billion adults globally remain outside of the financial system with no access to a traditional bank, even though one billion have a mobile phone and nearly half a billion have internet access.
To this end, payment systems such as Diem, based on blockchain, have been proposed. The Diem Blockchain is a decentralized, programmable database designed to support a low-volatility cryptocurrency that will have the ability to serve as an efficient medium of exchange for billions of people around the world. Novi is a new digital wallet for the Diem payment system.
As per the report by Research And Markets, the Global Digital Payment Market size is expected to reach $175.8 billion by 2026, rising at a market growth of 20% CAGR during the forecast period. A sister report by Grand View Research USD breaks down the growth of the global digital payment market size to $236.10 billion by 2028 (a CAGR of 19.4% from 2021 to 2028) by solution type as shown below.
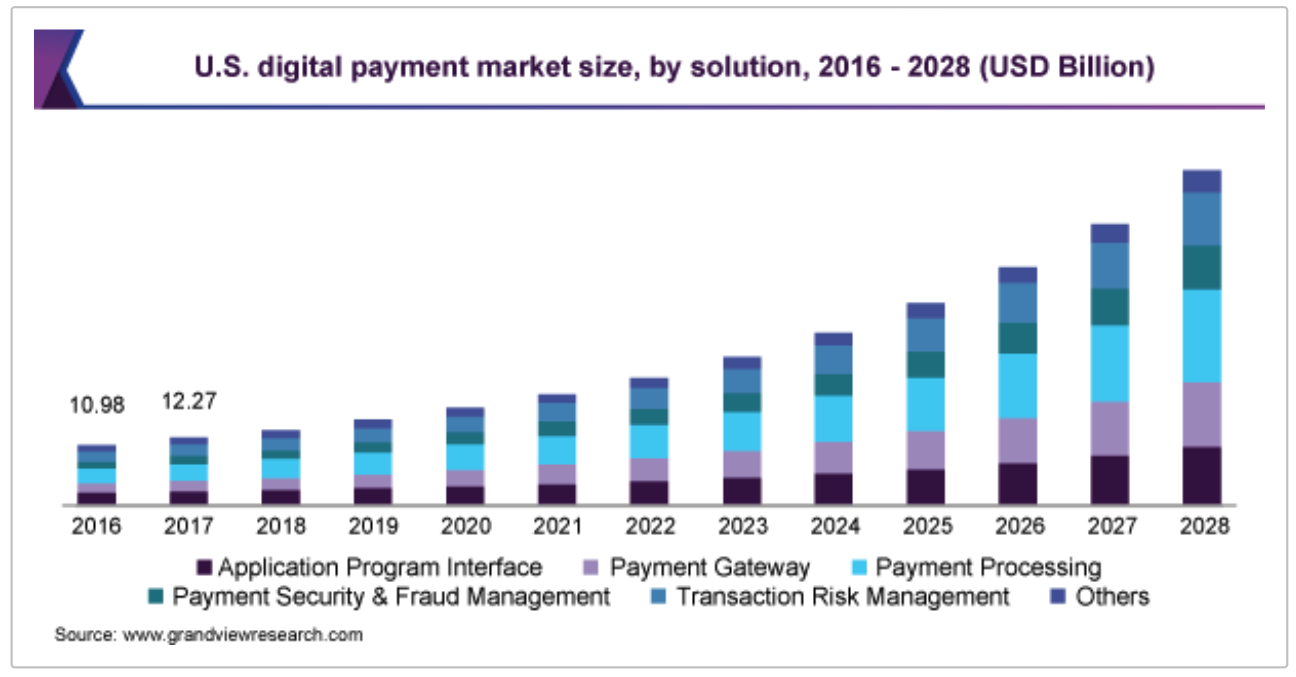
Source: Grandview Research
Factors driving the growth include, but not limited to, use of smartphones becoming ubiquitous, increasing demand for contactless payments and increasing customer expectations. In addition, factors such as the growing percentage of the global population using banking facilities and the growing adoption of open banking APIs are expected to create new growth avenues for the digital payment market. Headwinds include deteriorating perception of digital payments security over the past year and a growing concern with payments made via social apps and “Internet of Things” devices.”
Smooth payment performance is the bedrock of end-user’s e-commerce experience and, consequently, key to contain churn. Performance is no longer limited to an outage. In a report published in October 2020, Gartner highlighted that the traditional KPIs centered around payment performance have been thrown into a tailspin by COVID-19. Going forward, the report calls out the following metrics:
- Latency: This pertains to the response time in executing a payment. Increase in latency – it can be traced back to a wide variety of reasons such as, but not limited to, gateway or processor issues – could potentially result in timeouts, lost sales and violation of contractual SLAs. Outages (e.g., click here) impacts both the end customer as well as the merchant.
- Authorization and decline rates: This pertains to how many submitted transactions are approved for payment by the issuer. Typically, approval rates for transactions carried out at the physical point of sale (POS) typically achieve much higher approval rates than the digital commerce counterpart. In light of this, it is important to monitor the metric for POS and digital separately. Also, a sudden shift to digital may warrant a recalibration on the issuer side as well. Anomalies in the digital case can potentially stem from, for example, the fraud detection system being a bit aggressive to contain downside. In an article published last year, Fry highlighted the following flavors of payment acceptance problems:
- Lack of funds from the payment method
- “Card not present” transactions
- Wrong, missing or expired information
- Fraud triggers
- Payment requests don’t share the same format
- Genuine cross-border “foreign” transactions get easily declined
- Currency conversion
- Fraud detection rates: This pertain to how many submitted transactions successfully make it through the fraud screening tools and are processed for payment. As more and more first-time customers use digital channels, it may result in higher fraud detection rates online. In light of this, it is important to measure the online and offline fraud rates separately – this would help triage the impact on sales and take action accordingly.
- Payment processing costs: As in-store sales move online, credit and debit card processing fees will apply to a greater portion of your overall sales. Plus, rates are materially less expensive at the physical POS than they are online, thus the credit card processing fees per transaction – which includes interchange fees that are paid to the issuing bank, gateway fees, processor fees, fraud detection costs and more – are likely to increase.
In a similar vein, Kar called out Responsiveness – How quick is the service provider to address issues when a service request is raised by a user? – as one of the key factors impacting user experience in the context of mobile payments – significance value of this hypothesis was found to be less than 0.05 under the model described in therein. Further, the following is recommended:
“… enhance the speed at which complaints raised across channels surrounding failures of transactions are addressed … hugely impact the customer relationship management and impact positively the responsiveness perceived by the customer when any challenge is faced from the use of a digital payment platform.”
Delivery high payment performance is non-trivial. It stems from the complexity of the payments ecosystem as exemplified by the infographics below.
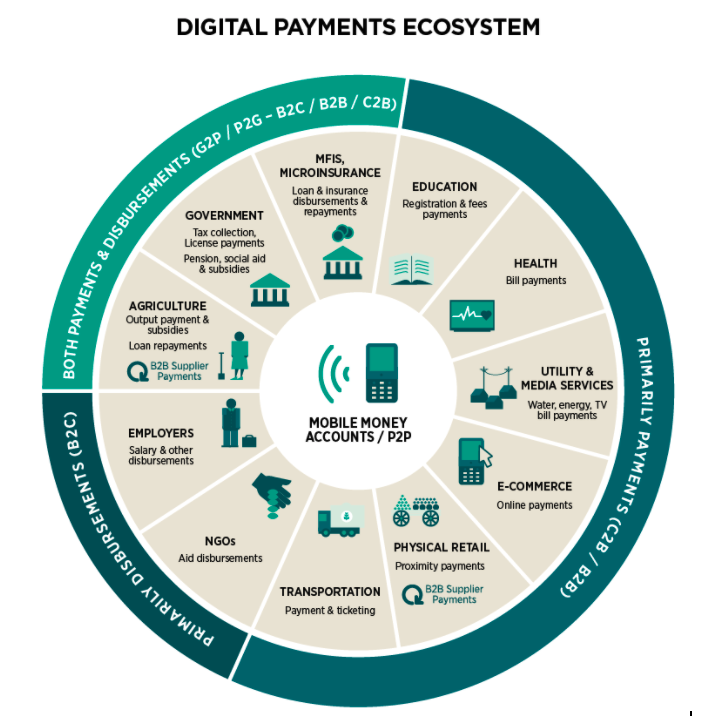
Source: GSMA
A deep pipeline between the customer and the merchant (refer to the figure below) and potentially a large set of vendors makes the payment experience susceptible to cascading effects. This is akin to the tail latency problem discussed by Dean and Barroso (also see this, this, this). They highlight:
“Even rare performance hiccups affect a significant fraction of all requests in large-scale distributed systems.”
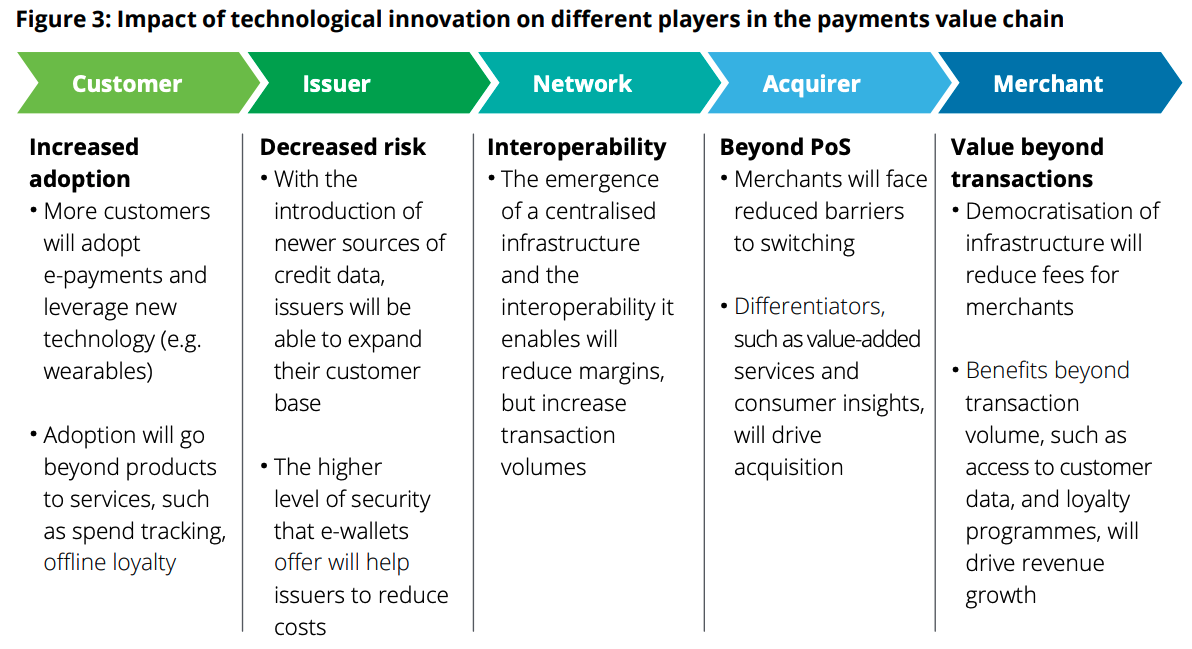
Source: Deloitte
Likewise, one or more factors such as, but not limited to, multiple API handshakes, network hiccups (lost connectivity and/or congestion), availability of one or more intermediaries, directly impact the end-user’s payment experience. Going forward, with blockchain based decentralized architecture gaining momentum, providing resilience against faults would pose an interesting problem. For now, we shall leave the discussion on that front for another time.
Correlation between two or more payment processing KPIs (as discussed in BlueSnap’s article) can help triage the impact to a merchant’s bottomline:
- Payment Conversion Rate
- Conversion Rate By Bank
- Conversion Rate By Payment Method And Card Type
- Checkout Abandonment Rate
- Landing Page Optimization Rate
- Mobile Vs. Desktop Clean Rate (defined as the total percentage of transactions that had a successful outcome)
- Fraud Rate
- Order Rejections Rate
- Chargeback Rate (defined as the number of transactions that are disputed by shoppers when they see an unfamiliar charge on their credit card bill)
- Uptime (what percentage of the day, week, or year is your provider online and processing successfully?)
Consider the transactions at an ATM as an example. Potential issues can pertain to, for example, authentication, anomalies in aggregated withdrawal – amount and/or # transactions – per day, abnormally high decline rate owing to the fraud detection system gone wrong. Also, in order to reduce mean time to remediation (MTTR), one may have to slice-and-dice the analysis by, for instance, type of ATM and geography.
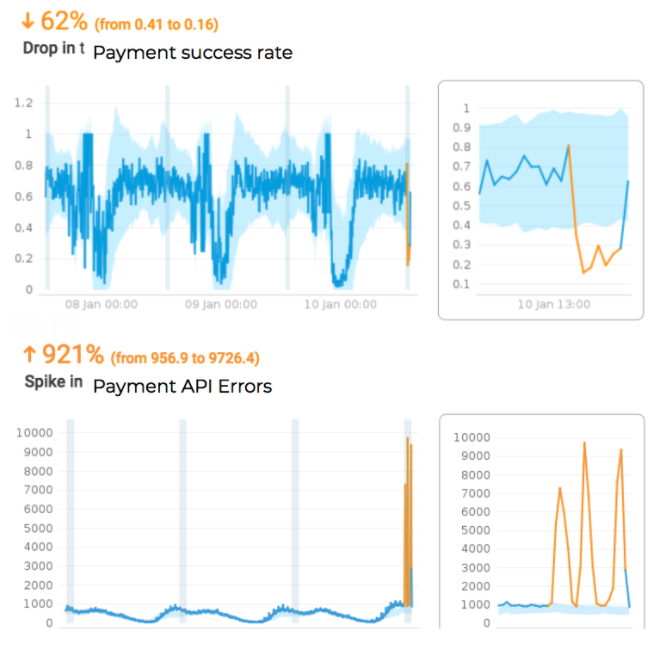
The two examples below illustrate the importance of anomaly detection and correlations for root cause analysis. In the first example, Anodot’s platform alerts on abnormal drops in payment transaction success rate broken down by payment providers, geography and more. A dip in the success rate for one payment provider in a certain county was correlated to increased errors in one of the payment APIs for one of the banks in that country – this played a key role in rapid remediation of the issue. Interestingly, one would expect the aforementioned to be close to 1.0; however, in practice, we observe that the transaction success rate rises during the day and falls at night (that is, more transactions are successfully completed during the day compared to night time) and are often far from 1.0.
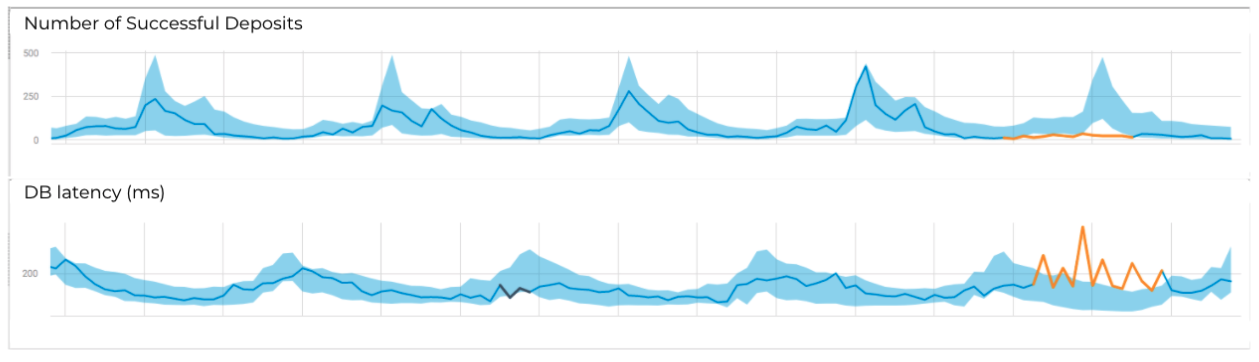
The second example comes from monitoring a trading platform. Metrics such as, # transactions and deposits are monitored to surface any potential issues. In the example below, the number of deposits for trading accounts dropped abnormally and was correlated with an increase in latency to the main database handling those transactions – leading to a quick RCA indicating an issue with the DB.
Recently, in order to boost the end-user experience, big bank adopted Anodot’s platform for payment and trading monitoring.
To wrap up, complexity of the payments ecosystem lies at the root of the issues that adversely impact end-user experience. The metrics are diverse and hence, discovering correlations between the metrics can help root cause the issue at hand and drive a reduction in mean time to remediation (MTTR). The benefits to fintech companies include reduction in operational expenses and risk, protection of revenue, and improved customer experience.
Continue this series to discover applications of and challenges with applying correlation analysis in:
- a wider business context
- ecommerce, specifically promotions
- fintech, specifically algorithmic trading
- network performance in telecommunications