
Revenue monitoring not only involves monitoring huge amounts of data in real-time but also finding correlations between thousands, if not millions, of customer experience and other metrics.
Are traditional monitoring methods capable of detecting a correlation between a drop in user log-ins and a drop in revenue as it’s happening? For many reasons, the answer is no.
The Power of AI-Based Monitoring
To kick off our “Good Catch” series, we’re sharing anomalies that Anodot caught for our customers, who flagged each of them as a “good catch” in our system.
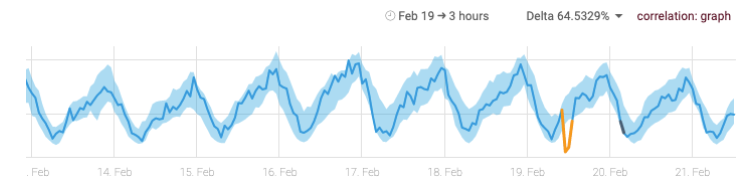
For an online gaming customer, Anodot alerted them to a drop in log-ins and correlated the anomaly to a spike in command errors, an incident that negatively impacted revenue.
A traditional monitoring system might have been able to catch a drop in revenue as it occurred, but without machine learning, this company would only have caught the connection between these two anomalies had an analyst happened to stumble upon them. An unlikely scenario.
The customer managed to release a fix within 3 hours, saving them a significant amount of otherwise lost revenue.
Adapting to Market Changes with AI
Given the subtlety of this alert at the start, using static thresholds would have taken longer for an alert to fire.
With the impact of COVID-19 on the travel industry, affected businesses who rely on static thresholds are having to manually adjust those settings to the new norm. They would again need to readjust those settings as travel bookings pick up, although at this time no one can accurately predict when that will be.
An AI-based monitoring solution, on the other hand, can adapt to the new normal, without the need for any human intervention. In particular, Anodot’s unsupervised learning algorithms are able to monitor thousands of metrics simultaneously and understand the normal behavior for each individual one. This ability to adapt to changing market conditions and consumer behavior can drastically improve a company’s ability to adjust growth and demand forecasts in real-time, both of which can significantly contribute to the bottom line.
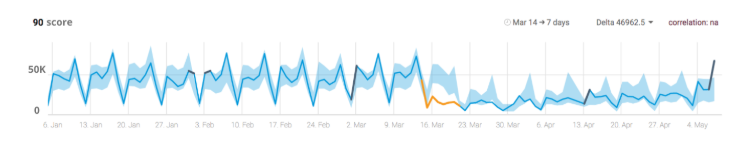
As you can see below, the shaded blue area represents the normal range of data. As the COVID-19 closures occurred in mid-March, you can see the AI monitoring solution was able to adjust its normal range and catch up with the global changes in bookings within days. Towards the end of the graph, we can also see there’s an increase towards the original range, which happened without any human intervention or a need to adjust a static threshold:
Real-Time Detection in a Complex Environment
A final example of the difficulty of building your own monitoring system is the fact that you’re dealing with human-generated data, meaning it’s incredibly volatile, irregular, and seasonal.
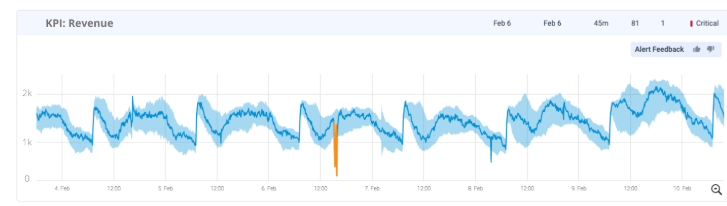
For example, the image below is from a gaming company and you can clearly see the seasonal nature of gamers playing more on the weekends and evenings. In this example, someone on the team released a hot fix, along with a critical bug, that prevented players from completing in-game purchases. Luckily, their anomaly detection solution was able to detect and alert the error in real-time, and root cause analysis led the developers directly to the recent release.
Since there is such a high degree of seasonality in this user-generated data, unlike a traditional BI tool, an AI solution is able to calculate the normal usage depending on each hour and day and adapt accordingly.
These incidents give you an under-the-hood look at the complexity in monitoring business metrics, some of which include:
- an adaptive baseline
- seasonality
- granular visibility
- monitor at scale to correlate related anomalies/events
- real-time detection
In the next post, we’ll look at why these aspects also come into play for finding hidden incidents that might otherwise go undetected in your partner networks and affiliate programs.


