The Microservice Simplicity Paradox
Rapid software release is the new norm – and that has pushed many companies to ditch their monolithic software development approach in favor of SOA. More companies are embracing microservices – an SOA-style approach for developing and deploying business logic as small, independently deployed services – for a number of reasons: it reduces risk, is faster to deploy and it easily scales.
Making the application modular allows us to deploy small changes without the need to replace unrelated and untouched code, as is the case with monolithic architecture. It also enables developers to detect issues faster, as there are fewer changes and code to keep track of with each deployment, making it easier to pinpoint issues.
Although microservices have theoretically simplified deployment, at scale monitoring is quite challenging. Teams typically deploy tens, hundreds and even thousands of features a day. Adding additional complexity are all the microservice dependencies. And then factor in all the software versions that concurrently exist on the same cluster. It’s impossible to manage this manually.
Enter the Service Mesh
Every service-oriented architecture, such as microservices, requires dedicated tools to control service-to-service communication. As the network communication grows in size and complexity, it can become harder to understand and manage. Service mesh technologies add an additional infrastructure layer on top of microservices for better observability, traffic management and, sometimes, to enhance security within the mesh.
You can find the top service mesh solutions at Layer5.io. One of the top solutions for troubleshooting service mesh issues is OpenTracing, which uses distributed tracing to log all the communications between services. Developers currently use this communication log to help find optimize and debug their code. Another popular software is Envoy proxy, which provides detailed service metrics that can be collected, monitored and observed by Prometheus.
While tools such as OpenTracing and Envoy allows developers to observe what’s happening within their microservices, they have some major drawbacks.
Observing Isn’t Scalable
To find incidents within a large service mesh, “observability” is impractical. Nobody has time or resources to visually monitor multiple clusters . Tools need to go beyond observing and actually detect issues, and that requires automated anomaly detection. To understand why, let’s look at how developers currently monitor the mesh.
How Companies Currently Monitor the Mesh
Every service mesh technology includes some kind of tools that “observes” or monitors the components that are directly responsible for meeting the service level agreement. Some of these described by Istio as the four “golden signals”: latency, traffic, errors and saturation.
Developers typically add other visualization tools to their analytics stack, such as Grafana, Prometheus and Kiali, to create dashboards and graph the services topology. Having these relationships mapped out makes it easier to identify issues and even alert when some paths are broken.
The Drawbacks: It Gets Meshy
Istio and others are doing a very good job in fetching metrics that allow developers to create dashboards. By applying manual alerts within the service mesh, it’s possible to find issues on a small application – as long as there’s a dedicated monitoring team to adjust the alerts accordingly.
However, this process proves much less effective on a large-scale deployment. Take the golden signals, for example. Imagine having to monitor latency across 100 microservices, each with a different SLA. It would take quite a bit of time to adjust each of those alert thresholds.
The question remains – with all the work being done to collect service mesh metrics, how is it that there’s no cloud-native anomaly detection solutions for creating an autonomous service mesh management platform?
Service Mesh Monitoring and Anomaly Detection
Imagine a system that automatically learns the behavioral patterns of every new microservice. It can automatically fire alerts on significant changes, which would help improve time to detection and eventually help prevent distributions. Developers can achieve all this with anomaly detection that employs machine learning techniques.
ML algorithms automatically learn each signal’s behavioral patterns and filter out the most critical incidents for alerts. It should seamlessly integrate with the service mesh to monitor top-level KPIs all the way down to the most granular signals.
Here’s an example of how Istio and an anomaly detection solution can work together to detect incidents. In this case, we used Anodot.
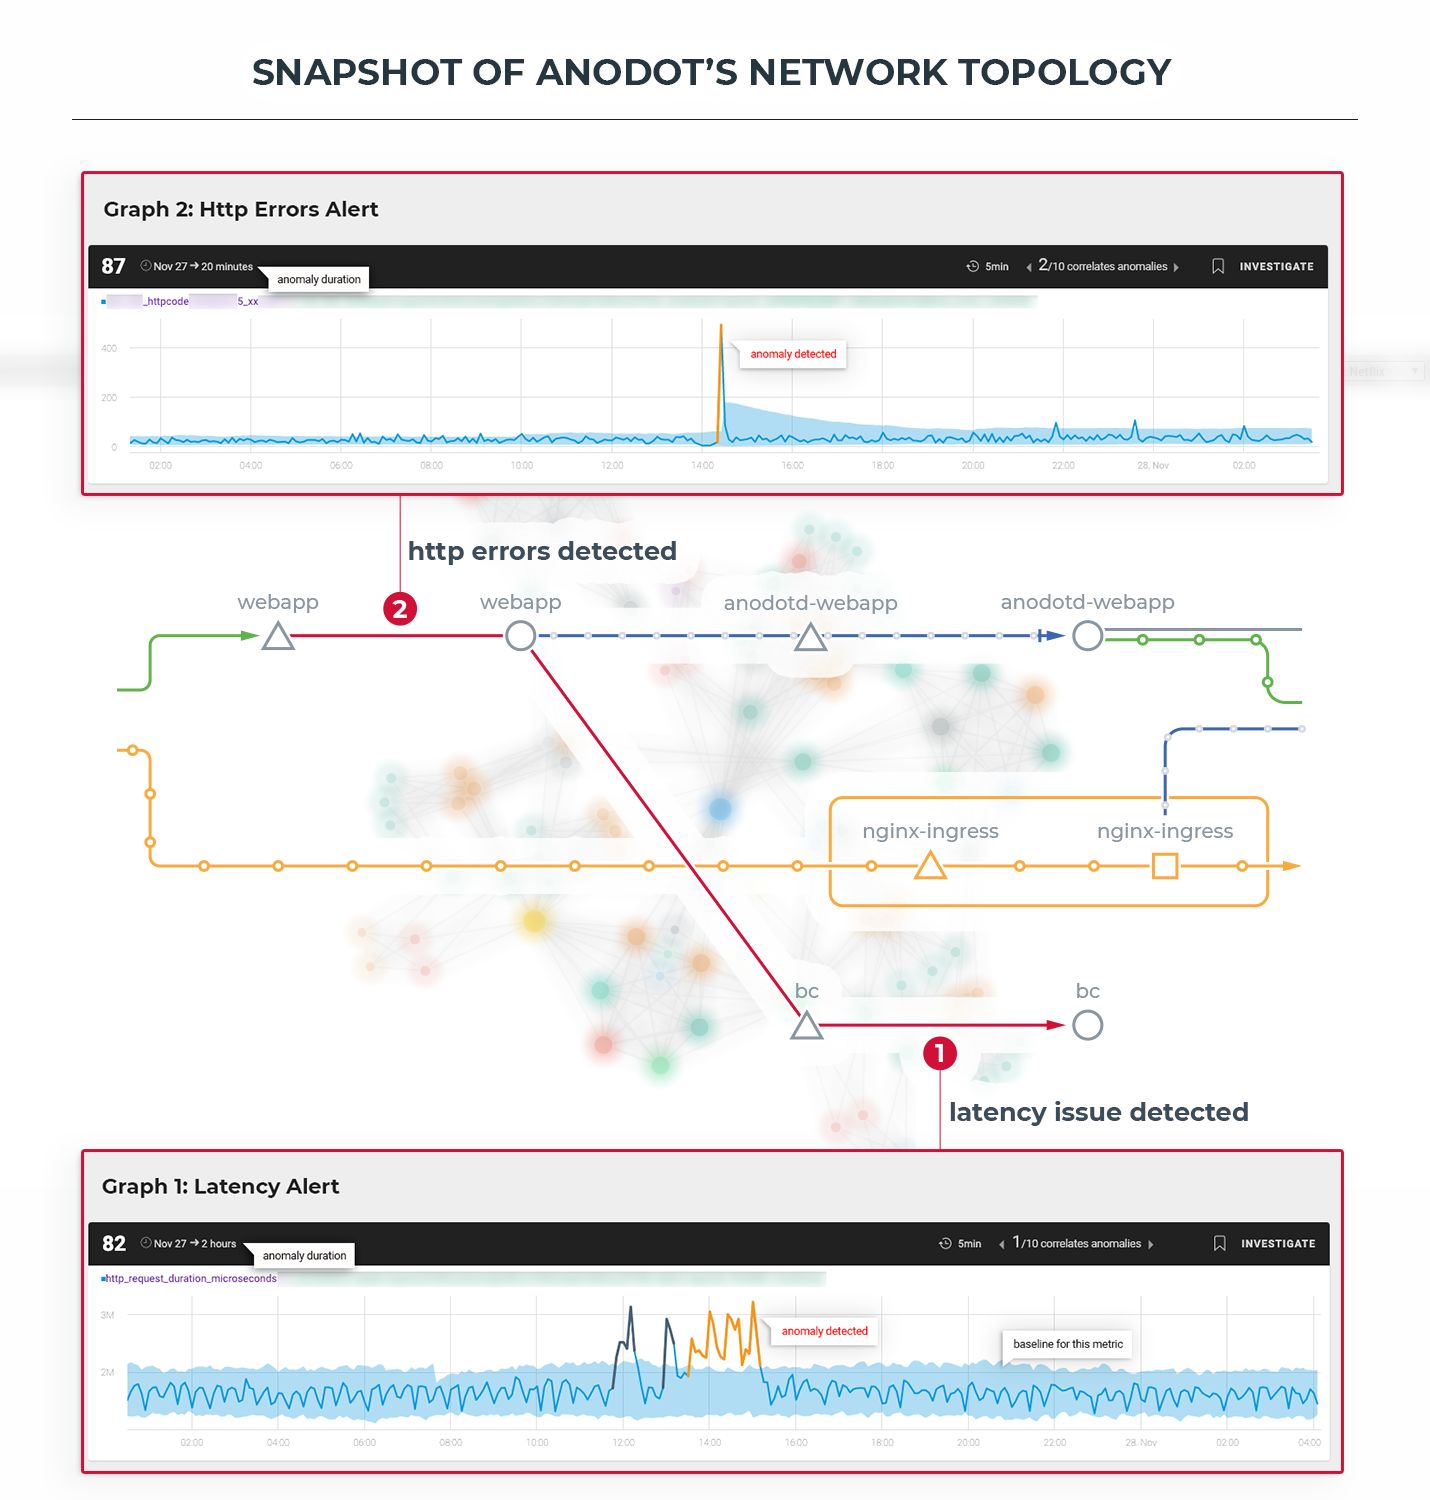
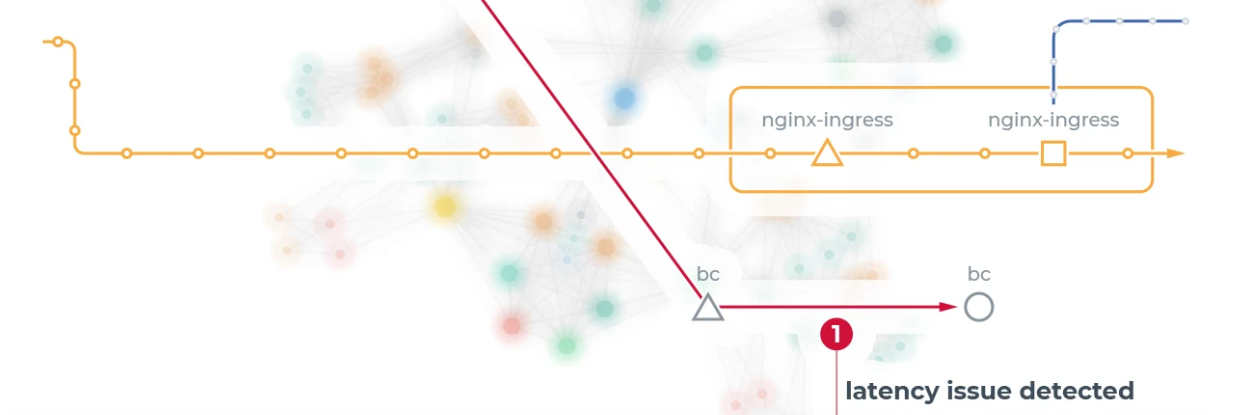
Monitoring the Mesh: To demonstrate how service mesh monitoring works, I applied Anodot’s anomaly detection on the company’s own network. It uses source and destination information to recreate the incident’s pathway, illustrated above with Anodot alerts and Kiali’s visualization tool. Metrics from Envoy can be connected to Anodot with the available Prometheus plug-in.
Anodot’s anomaly detection takes that time series data and learns its behavior over time, along with seasonal patterns, and alerts when there’s a critical anomaly. When this happens, Anodot sends a real-time alert to email, Slack or Webhook. The alert lists the first affected microservice, along with a list of correlated anomalies, in chronological order, that occurred during that time period. This can help you easily trace back the breadcrumbs to the root cause.
Anomaly Detection: What to Look for
Anomaly detection is the piece that’s currently missing from most developers’ analytics stack. Ironically, there is no way to monitor a large-scale service mesh without it.
While it’s an emerging field, there are anomaly detection solutions available. It is hard however find options that provide all the following capabilities:
- Autonomous: Independently tracks and learns data in real time, and pushes alerts when needed. Understands seasonal patterns.
- Lowest false positives: False positives create unnecessary noise and unreliable alerts. The solution should calculates the significance of each anomaly in relation to its expected behavior and only send alerts when it passes a critical score.
- Correlation: The system should automatically learn the topology and connect the dots.
Cleaning up the Mesh with Machine Learning
Managing microservices in both startups and enterprise environments, I have experienced all kinds of issues at scale. Sometimes it takes hours, days and even months to find them. Sometimes the issues are never found and need to implement a workaround.
As you move to greater use of microservices, you’ll find yourself confronted with challenges in meeting your service level agreement (SLA). I believe service mesh technologies are essential for managing and learning how traffic behaves within the mesh, as they provide greater control over and insights into service-to-service communication. Pairing that with a dedicated anomaly detection solution that correlates issues will enable you to detect incidents as they occur and to systematically reduce mean time to detection (MTTD) and mean time to resolution (MTTR).


