Resources

FILTERS

Resources

Documents 1 min read

Increasing customer retention and facilitating upsells

“Anodot has dramatically decreased the number of support tickets and increased customer satisfaction.”
Blog Post 6 min read

Practical Elasticsearch Anomaly Detection Made Powerful with Anodot

Elasticsearch is a great document store that employs the powerful Lucene search engine. The ELK stack provides a complete solution for fetching, storing and visualizing all kinds of structured and unstructured data. ELK has been traditionally used for log collection and analysis, but it is also often used for collecting business and application data, such as transactions, user events and more. 
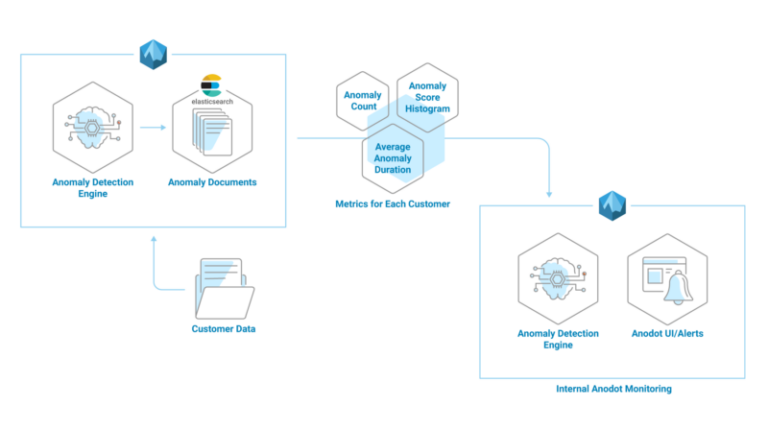
At Anodot, we use Elasticsearch to store the metadata describing all of the anomalies our system discovers across all of our customers. We index and query millions of documents every day to alert our customers to and provide visualizations of those anomalies, as an integral part of our anomaly detection solution. Below is a diagram illustrating the Anodot system architecture. Detecting and investigating issues that are somehow hidden within the huge amount of documents is a difficult task, especially if you don’t know what to look for beforehand. For example, a glitch in one of our own algorithms can lead to a sharp increase (or decrease) in the number of anomalies our system discovers and alerts on for our customers. To minimize the possible damage this kind of a glitch could cause to our customers, we query the data we store in Elasticsearch to create metrics which we then feed into our own anomaly detection system, as seen in the illustration below. This allows us to find anomalies in our own data so we can quickly fix any glitches and keep our system running smoothly for our customers. Harnessing Elasticsearch for Anomaly Detection We have found that using our own anomaly detection system to find anomalies, alert in real time and correlate events using data queried from Elasticsearch or other backend systems is ridiculously easy and highly effective, and can be applied to pretty much any data stored in Elasticsearch. Many of our customers have also found it convenient and simple to store data on Elasticsearch and query it for anomaly detection by Anodot, where it is then correlated with data from additional sources like Google Analytics, BigQuery, Redshift and more. Elasticsearch recently released an anomaly detection solution, which is a basic tool for anyone storing data in Elasticsearch. However, as seen in the diagram above, it is so simple to integrate data from Elasticsearch into Anodot together with all of your other data sources, for the added benefit that Anodot’s robust solution discovers multivariate anomalies, correlating data from multiple sources. Here is how it works:    Collecting The Documents: Elasticsearch Speaks the Anodot language The first thing that needs to be done is to transform the Elasticsearch documents to Anodot metrics. This is typically done in two ways: Using Elasticsearch Aggregations to pull aggregated statistics including: Stats aggregation – max, min, count, avg, sum Percentile aggregation – 1,5,25,50,75,95,99 Histogram – custom interval Fetch “raw” documents right out of Elasticsearch, and build metrics externally using other aggregation tools (either custom or existing tools like statsd). We found method 1 to be easier and more reasonably priced. By using the built-in Elasticsearch aggregations, we can easily create metrics from the existing documents. Let’s go through an example of Method A. Here, we see a document indexed in Elasticsearch describing an anomaly: {        "_index": "anomaly_XXXXXXXXXXX",        "_type": "anomaly_metrics",        "_id": "07a858feff280da3164f53e74dd02e93",        "_score": 1,        "_ttl": 264789,        "_timestamp": 1494874306761,        "value": 2,        "lastNormalTime": 1494872700,        "timestamp": 1494874306,        "correlation": 0,        "maxBreach": 0.2710161913271447,        "maxBreachPercentage": 15.674883128904089,        "startDate": 1494873960,        "endDate":,        "state": "open",        "score": 60,        "directionUp": true,        "peakValue": 2,        "scoreDetails": "{"score":0.6094059750939147,"preTransform":0.0}",        "anomalyId": "deea3f10cdc14040b65ecfc3a120b05b",        "duration": 60,        "bookmarks": [          ]        } The first step is to execute an Elasticsearch query to fetch statistics from an index which includes a “score” and a “state” field, i.e. aggregate the “score” field values to generate several statistics: percentiles, histogram (with 10 bins) and count, for all anomalies where the “state” field is “open” as seen below. { "size": 0, "query": { "bool": { "must": [ { "term": { "state": "open" } } ] } }, "aggs": { "customer": { "terms": { "field": "_index", "size": 1000 }, "aggs": { "score_percentiles": { "percentiles": { "field": "score" } }, "score_stats": { "stats": { "field": "score" } }, "score_histogram": { "histogram": { "field": "score", "interval": 10, "min_doc_count": 0 } } } } } This would be the response: { "took": 851, "timed_out": false, "_shards": { "total": 5480, "successful": 5480, "failed": 0 }, "hits": { "total": 271564, "max_score": 0, "hits": [] }, "aggregations": { "customer": { "doc_count_error_upper_bound": 0, "sum_other_doc_count": 0, "buckets": [ { "key": "customer1", "doc_count": 44427, "score_stats": { "count": 44427, "min": 20, "max": 99, "avg": 45.32088594773449, "sum": 2013471 }, "score_histogram": { "buckets": [ { "key": 20, "doc_count": 10336 }, { "key": 30, "doc_count": 7736 }, { "key": 40, "doc_count": 8597 }, { "key": 50, "doc_count": 8403 }, { "key": 60, "doc_count": 4688 }, { "key": 70, "doc_count": 3112 }, { "key": 80, "doc_count": 1463 }, { "key": 90, "doc_count": 92 } ] }, "score_percentiles": { "values": { "1.0": 20, "5.0": 21, "25.0": 30.479651162790702, "50.0": 44.17210144927537, "75.0": 57.642458100558656, "95.0": 76.81333333333328, "99.0": 86 } } }, Once we receive the Elasticsearch response, we use code like the example below to transform the data into Anodot’s Graphite protocol and submit it to our open source Graphite relay (available for Docker, NPM and others). Anodot Transforming Code: #!/usr/bin/env ruby require 'graphite-api' @CONNECTION = GraphiteAPI.new(graphite: $graphite_address) @CONNECTION.metrics({ " #{base}.target_type=gauge.stat=count.unit=anomaly.what=anomalies_score" => customer['score_stats']['count'], " #{base}.target_type=gauge.stat=p95.unit=anomaly.what=anomalies_score" => customer['score_percentiles']['values']['95.0'], " #{base}.target_type=gauge.stat=p99.unit=anomaly.what=anomalies_score" => customer['score_percentiles']['values']['99.0']}) Anodot Graphite Protocol: “what=anomalies_score.customer=customer1.stats=p99” “what=anomalies_score.customer=customer1.stats=p95” “what=anomalies_score.customer=customer1.stats=counter” “what=anomalies_score.customer=customer1.stats=hist10-20” By applying the method above, it is possible to store an unlimited number of metrics efficiently and at low cost. Submitting Metrics to Anodot Anodot’s API requires a simple HTTP POST to the URL: https://api.anodot.com/api/v1/metrics?token=<user’s token> The actual HTTP request’s body is a simple JSON array of metrics objects in the following format: [ { "name": "<Metric Name>", "timestamp": 1470724487, "value": 20.7, } ] Since Anodot provides many integration tools to existing systems, in particular the Graphite relay and Statsd, any tool that implements a Graphite Reporter can be used to submit the metrics. This may include a customer code or even the Logstash itself. A scheduled cron job can be set to submit these metrics regularly. For more information on the various ways to submit metrics to Anodot, visit our documentation page. Detecting and Investigating Anomalies with Anodot We recently had a misconfiguration of one of the algorithms used for one of our customers that led to a temporary increase in the number of anomalies detected and a decrease in their significance score. The issue was detected quickly in our monitoring system, so we were able to deploy a new configuration and restore normal functions before the glitch was noticeable to our customer. In another case (below), we received an alert that the number of anomalies discovered for a customer increased dramatically in a short period of time. The alert was a positive one for us because this was a new customer in their integration phase, and the alert signaled to us that our system had “learned” their data and had become fully functional. Our customer success team then reached out to initiate training discussions. Note that the data metrics from Elasticsearch can be correlated within Anodot to metrics from other backend systems. We do this for our own monitoring and real-time BI, and I’ll go into more depth about this in a later post.
Blog Post 5 min read

Nipping it in the Bud: How real-time anomaly detection can prevent e-commerce glitches from becoming disasters

#GlitchHappens. That’s an unavoidable consequence of the scale and speed of ecommerce today, especially when lines of code set and change prices in seconds. Unavoidable, however, doesn’t have to mean catastrophic, especially if a real-time anomaly detection system is deployed. In two real-world glitch incidents, we’ll see the cost of not employing real-time automated anomaly detection in ecommerce. Our connected world is made possible not only by glass threads pulsing with data, but also by the connections between vendors, clients, consumers and government agencies which enable goods, services, and even financial assistance to be delivered to those who need them. As we’ll find out, Walmart learned a break in that chain anywhere can lead to pain everywhere. EBT spending limits hit the roof…and Walmart picks up the tab Due to a series of failures in the electronic benefit transfer (EBT) system in certain areas, the system allowed card holders to make food purchases at retailers, but without spending limits. Even though Walmart’s management realized something was wrong, they still decided to allow all these EBT purchases, rather than deny food to low-income families. In Walmart stores in two Louisiana cities in particular, entire shelves were emptied as EBT shoppers brought full shopping carts to the checkout. Some Walmart stores in the are were forced to close due the number of customers inside exceeding fire safety limits. All of this occurred in the narrow two-hour window the EBT spending limit glitch lasted. When the system was fixed and Walmart announced the spending limits were restored, some shoppers were forced to abandon their carts. In one case, a woman with a forty-nine cent balance on her card was stopped just as she approached the checkout with  $700 of food in her cart. The cumulative cost inflicted by the glitch hasn’t been publicly disclosed, but if the $700 example is representative, those Louisiana Purchases probably reached six figures. An anomaly detection system would have been tremendously helpful Had Walmart been using Anodot to monitor all of the metrics across the company, a number of anomalies would have been detected in minutes in the individual store-level time series data: On-shelf inventory of food items (sudden decrease) Sales volume (sharp increase) Volume of EBT transactions (large increase) Average dollar amount of EBT transactions (skyrocketing increase) Not only would Anodot’s anomaly detection system detect each of these individual metrics, but it would also combine these separate signals into an actionable alert which told the complete story of what was going on. It would become clear that the anomalies originated from the same stores and within a single state; therefore, Walmart would have known within minutes that there was a multi-store problem with EBT in Louisiana. Walmart’s EBT glitch shows the potential corporate damage of a massive volume of glitch purchases. A glitch incident at Bloomingdale’s, however, shows that the other extreme occurs too: a much smaller volume of high-dollar glitch purchases. Bloomingdale’s bonus points glitch A simple coding error in the software powering Bloomingdale’s “Loyalist” points system caused store credit balances to equal the point balances, not the equivalent cash value of those point balances. Since the two are separated by a factor of 200, this left a few Bloomingdale’s shoppers pleasantly surprised. Word quickly spread on social media informing more customers of the opportunity. Some made online purchases, many of which were canceled by Bloomingdale’s after the glitch was discovered and fixed a day later. Yet, like the Walmart glitch, it’s the in-store purchases which really inflict the most damage during a glitch. One man spent $17,000 on in-store purchases, but could have walked away with even more merchandise since the glitch gave him $25,000 of credit. How Anodot could have prevented this bug from blooming Anodot would have detected a sudden, large jump in the gift card value to points ratio as soon as that data was reported and fed into the real-time anomaly detection system. Bloomingdale’s could have then temporarily disabled the Loyalist points of the affected accounts. Anodot would have also detected the large, sudden uptick in the average dollar value of online purchases made with Loyalist points, both online and at physical stores. The increase of both Bloomingdale’s mentions on social media and gift card usage would have been correlated with the other anomalies to not only show the specific problem, but also draw attention to the fact that many, many people were actively taking advantage of it. Quickly and definitively proving that this was a business incident which needed to be fixed now. Shoppers today are savvy users of online deal sharing websites and social media, and wield these tools to help themselves and others instantly pounce on drastic discounts or free buying power, regardless if it’s from a legitimate promotion or system glitch. In this commerce environment, companies must react even faster to identify, contain and fix glitches when they happen. Not everyone will stop at $17,000.
Blog Post 4 min read

Why Ad Tech Needs a Real-Time Analysis & Anomaly Detection Solution

Better Ad Value Begins with Better Tools: Why Ad Tech Needs a Real-Time Anomaly Detection Solution An expanding component of today’s online advertising industry is Ad Tech: the use of technology to automate programmatic advertising – the buying and selling of advertisements on the innumerable digital billboards along the information superhighway. When millions of pixels of digital ad space are bought and sold every day, bids are calculated, submitted and evaluated in milliseconds, and the whole online advertising pipeline from brand to viewer involves several layers of interacting partners, clients and competitors - all occurring on the gargantuan scale and at the hyper speed of the global Internet. In this complex, high speed and high speed industry, money is made - and lost - at a rapid rate. Money, however, isn’t the only thing that changes hands. It’s the data – cost per impression, cost per click, page views, bid response times, number of timeouts, and number of transactions per client – which is as important as the money spent on those impressions because it’s the data which shows how effective the ad buys really are, thus proving whether or not they were worth the money spent on them. Therefore, the data is as important as the cost for correctly assessing the value of online marketing decisions. That value can fluctuate over time, which is why the corresponding data must always be monitored. As we’ve pointed out in previous posts, automated real-time anomaly detection is critical for extracting actionable insights from time series data. As a number of Anodot clients have already discovered, large scale real-time anomaly detection is a key to success in the Ad Tech industry: Netseer Breaks Free from Static Thresholds Ad Ttech company Netseer experienced the two common problems of relying on static thresholds to detect anomalies in their KPIs: many legitimate anomalies weren’t detected and too many false positives were reported. After implementing Anodot, Netseer has found many subtle issues lurking in their data which they could not have spotted before, and definitely not in real time. Just as important, with this increased detection of legitimate anomalies came fewer false positives. Anodot’s ease of use, coupled with its ability to import data from Graphite is fueling its adoption across almost every department at Netseer. Rubicon Project Crosses the Limits of Human Monitoring Before switching to Anodot, manually set thresholds were also insufficient for ad exchange company Rubicon Project, just as they were for Netseer. The inherent limitations of static thresholds were compounded by the scale of the data Rubicon needed to monitor: 13 trillion bids per month, handled by 7 global data centers with a total of 55,000 CPUs. Anodot not only provides real-time anomaly detection at the required scale for Rubicon Project, but also learns any seasonal patterns in the normal behavior for each of their metrics. Competing solutions are unable to match Anodot’s ability to account for seasonality, which is necessary for avoiding both false positives and false negatives, especially at the scale needed by Rubicon Project. Like Netseer, Rubicon Project was already using Graphite for monitoring, so Anodot’s ability to pull in that data meant that Rubicon Project was able to see Anodot’s benefits immediately. Eyeview: No More Creeping Thresholds and Alert Storms Video advertising company Eyeview had to constantly update its static thresholds as traffic increased and variability due to seasonality continuously made those thresholds obsolete. Limited analyst time that could have been spent on uncovering important business events was instead diverted to updating thresholds and sifting through the constant flood of alerts. Eyeview’s previous solution was unable to correlate anomalies and thus, unable to distinguish between a primary anomaly from an onslaught of anomalies in the alert storms. After switching to Anodot, the alert storms have been replaced by more concise and prioritized alerts, and those alerts are triggered as soon as the anomaly occurs, long before a threshold is crossed. Ad Tech needs real-time big data anomaly detection Anodot provides an integrated platform for anomaly detection, reporting, and correlation which you can leverage from a simple interface your whole organization can access. Whether you’re a publisher, digital agency or a demand-side platform, better ad value begins with better tools, and only Anodot’s automated real-time anomaly detection can match the scale and speed required by Ad Tech companies.
Blog Post 6 min read

Evaluating the Maturity of Your Analytics System

.post-content table#custom-table-32 th, .post-content table#custom-table-32 td {padding: 9.5px;} I’m a big fan of maturity models. They help teams clearly articulate their vision and define a path forward. You can tie the product roadmap and projects to the model and justify budgets needed to reach the desired maturity level. Gartner offers the following “Analytics Spectrum” that describes how analytics platforms evolve in two main dimensions: Sophistication level of the analytics Amount of human intervention required in the decision-making process towards a desired action. The most common form of analytics is descriptive, with few that offer some level of diagnostics. Predictive Analytics are not yet mature, but we clearly see an increasing demand for a better prediction model and for longer durations. As for prescriptive analytics -- the icing on the cake -- there are very few organizations that have reached that level of maturity and are applying it in very specific use cases. As you can imagine, at the highest maturity level, an analytics platform provides insights about what is going to happen in the future and takes automated actions to react to those predictions. For example, an e-commerce web site can increase the price of a specific product if the demand is expected to increase significantly. Additionally, if the system detects a price increase by competitors, they can send a marketing campaign to customers that are interested in that product to head off declining sales, or they can scale up or down based on changes in traffic volumes. Taking the Gartner model into consideration, I have developed a new maturity model which takes a slightly different (but very much related) approach to help you evaluate the current state of your monitoring/analytics system and plan in which areas you want to invest. This model is to be used as a guide since each company will be at its own level of maturity for each of the monitoring system capabilities. Moving down the left side of the table below, we see the Monitoring System Key Capabilities: Collect (business and infrastructure metrics), Detect, Alert, Triage, Remediate. The numbers from left to right are the different levels of maturity of each of these capabilities. And lastly, on the right, are the KPIs affected by each capability, that I explained in more detail in the first post of this series: TTD (Time to Detect), TTA (Time to Acknowledge), TTT (Time to Triage), TTR (Time to Recover), and SNR (Signal to Noise Ratio).   Monitoring System Key Capability Maturity Level Affected KPIs 1 2 3 4 5 Collect (Business Metrics) Key metrics at Site/Company level Key metrics at product line, geography level Secondary level metrics at product line, geography, customer/partner Key and Secondary metrics at page, OS and browser level Fine grain dimensions per transaction TTD, TTR Collect (Infrastructure Metrics) Key metrics for key components at Site level Key metrics for key components at availability zone/data center level Key metrics per component in the entire technology stack (database, network, storage, compute etc.) Key metrics per instance of each component Fine grain dimensions per component/instance TTD, TTR Detect Human factor (using dashboards, customer input etc.) Static Threshold Basic statistical methods (week over week, month over month, standard deviation), ratios between different metrics Anomaly detection based on machine learning Dynamic anomaly detection based on machine learning with prediction TTD Alert Human factor (using dashboards, customer input etc.) Alert is triggered whenever detection happens on single metric The system can suppress alerts using de-duping, snoozing, minimum duration Alerts simulation, enriched alert Correlated and grouped alerts to reduce noise level and support faster triaging SNR, TTA Triage Ad Hoc (tribal knowledge) Initial play book for key flows Well defined play book with set of dashboards/scripts to help identify the root cause Set of dynamic dashboards with drill down/through capabilities and to help identify the root cause Auto Triaging based on advanced correlations TTT Remediate Ad Hoc Well defined standard operating procedure (SOP), manual restore Suggested actions for remediation, manual restore Partial auto-remediation (scale up/down, fail over, rollback, invoke business process) Self-Healing TTR One thing to consider is that the “collect” capability refers to how much surface area is covered by the monitoring system. Due to the dynamic nature of the way we do business today, it’s kind of a moving target -- new technologies are introduced, new services are being deployed, architecture change, and so on. Keep it in mind as you might want to prioritize and measure progress in the data coverage. You can use the following spider diagram to visualize the current state vs. the desired state of the different dimensions. If you want to enter your own maturity levels and see a personalized diagram, let me know and I'll send you an spreadsheet template to use (for free, of course). The ideal monitoring solution is completely aware of ALL components and services in the ecosystem it is monitoring and can auto-remediate issues as soon as they are detected.  In other words, it is a self-healing system. There are some organizations that have partial auto-remediation (mainly around core infrastructure components) by leveraging automation tools integrated into the monitoring solution. Obviously, to get to that level of automation requires a high level of confidence in the quality of the detection and alerting system, meaning the alerts should be very accurate with low (near zero) false positives. When you are looking to invest in a monitoring solution, you should consider what impact it will make on the overall maturity level. Most traditional analytics solutions may have good collectors (mainly for infrastructure metrics), but may fall short when it comes to accurate detection and alerting; the inevitable result, of course, is a flood of alerts. A recent survey revealed that the top 2 monitoring challenges organizations face are: 1) quickly remediating service disruptions and 2) reducing alert noise. The most effective way to address those challenges is by applying machine learning-based anomaly detection that can accurately detect issues before they become crises, enabling the teams to quickly resolve them and prevent them from having a significant impact on the business.
Blog Post 6 min read

Deliver Results at Scale: Supervised vs. Unsupervised Machine Learning Anomaly Detection Techniques

In this final installment of our three-part series, let’s recap our previous discussions of anomalies – what they are and why we need to find them. Our starting point was that every business has many metrics which they record and analyze. Each of these business metrics takes the form of a time series of data...
Documents 1 min read

Case Study: Autonomous Monitoring for Telco BSS

Learn how leading telcos are using Anodot's ML-based anomaly detection to ensure business support systems can keep pace with the high level of service required for mission-critical applications.
Documents 1 min read

Case Study: Autonomous Monitoring for Telco OSS

Learn how leading telcos are using Anodot and its real-time alerts to automatically monitor their network operations for proactive incident management.
Blog Post 3 min read

The App Trap: Why Every Mobile App Needs Anomaly Detection

If you're one of the many consumers using native apps 90% of the time you're on your smartphone, you know first hand that mobile apps are big business. So big, in fact, that they are expected to generate 188.9 billion U.S. dollars in revenues via app stores and in-app advertising by 2020. There's an app for just about everything, from games to ebooks, to dating, cooking, shipping, sharing photos and more, businesses are developing more and more mobile apps to reach and engage their customers. But do these apps make money? In addition to charging for the app, many app developers monetize through advertising, in-app purchases, referrals and cross promotions.   https://youtu.be/UBzh4McuFDc Once using an app, businesses offer targeted advertising per user, options for premium content like access to extra levels or additional features, suggestions for additional apps by the same company or for related content that the company will receive revenue from for referring anyone who clicks through and converts. With so many moving parts (e.g. frontend, backend, advertising platforms, partners), there are a multitude of opportunities for something to break, such as partner integration or data format changes, device changes like OS updates or new devices, external changes like media coverage or social media exposure, and company changes like deployments, new game releases, AB tests and more. Just like the butterfly effect, where the flap of a butterfly's wings can cause a string of events leading to a huge storm, if one element of an application is working less than optimally, it can cause major problems elsewhere, which translates into unhappy customers, uninstalls, revenue losses and drops in market share. With traditional BI and monitoring tools like dashboards and alerts, you may only realize that something has broken down once your uninstall numbers begin to rise or you notice that users have stopped returning. Only a small percentage of very dedicated users will try a crashing app more than twice, so fixing the problem before you've lost users in droves is of key importance. So, how can you mitigate problems on your business's mobile app keeping users happy and engaged? In a recent session at Strata Data San Jose, Ira Cohen, Anodot's Chief Data Scientist and co-founder, presented "The App Trap: Why Every Mobile App Needs Anomaly Detection," showing how to use automated anomaly detection to monitor all areas of your mobile app to fully optimize it. Watch the full video to learn more about the processes involved in automated anomaly detection -- metric collection, normal behavior learning, abnormal behavior learning, behavior topology learning and feedback-based learning -- and how, together, they can keep your app on track, making money, and keeping users happy.