Anodot Resources Page 54

FILTERS

Anodot Resources Page 54

Blog Post 2 min read

Saving Electricity with DIY Connected Home and Anodot

Like most of us, Eli Mordechai hates wasting electricity. However as Chief Architect & Technology Evangelist Service/Network/Environment Virtualization at HP, he has the skills to put his distaste for waste into action. To ensure that an air conditioner would never be left running in an empty room again, he hacked together several off-the-shelf tools to build his own smart home IoT system. He shared his methodology this Embedded Computing Design article. Building on top of an Arduino Uno board, he was able to collect and visualize data from temperature, humidity and motion sensors he installed in his house. However he quickly discovered that visualizing was not enough, that he needed a system that would track the data, understand its patterns, and notify him when an abnormality occurred. For example, if there was no motion in the room, but the A/C was left on, the temperature and humidity would drop abnormally. So on top of his IoT system, he implemented PubNub – a real time data stream network to stream sensor data – and Anodot – a platform that collects and automatically analyzes data and alerts when abnormal patterns are detected. Eli goes into lots of technical detail about how he set the system up and how it works. Read the whole article here.
Blog Post 4 min read

How Anodot Came to Be: Our Origin Story

It was another morning in the office. I went over the daily rides report and noticed a slight decline in the total number of rides from our clients in Russia.  As CTO of GetTaxi (also known as Gett), a mobile service that allows users to order taxis in a single click, going over reports like this was a daily part of my job. I immediately started to investigate why the decline occurred. Knowing that collecting business activity data was critical to the success of any web service, I needed to ensure that this data was accessible in our reports and dashboards. Real Time Data; Delayed Diagnosis The first step we took was to examine whether or not the dip in the report was significant, and if so, to discover where and why it occurred.  After several hours of drilling into the different metrics related to rides in Russia, we discovered that indeed the dip was important – the reason for the decrease in the number of rides was because a subset of the users did not receive the SMS messages they needed to validate their rides. It took several more hours to discover that the cessation of the text messages originated from one of the SMS providers, and several more hours to fix the issue.  The whole issue took 48 hours to resolve, and resulted in a real loss of revenue. This kind of challenge was not unique. I noticed that typically we received our business insights with at a latency of at least 12-24 hours, plus another 24 hours or so to understand and react to the discovered insight. This prompted me to start looking for a solution that could provide us with real-time insights that were much simpler to investigate. After all, we collected all the data in real-time. If required, we could graph any of this data with our existing metric/dashboard infrastructure – if we knew which data to look at. Collect, Visualize and Track All Metrics on a Large Scale There were plenty of solutions for collecting, visualizing and generating reports on our data, both open source and commercial, but none of them solved my problem – we still needed to know what questions to ask in order to gain insights about all aspects of our service. The solutions that looked the most promising implemented automated machine learning – more specifically, anomaly detection. Open source tools such as Etsy (Skyline and Oculus), coupled with Graphite, seemed to be what we needed. However, implementing them would require at least one data scientist and additional development efforts. Even then, it wasn’t clear that they would solve our problem. We needed a product that would do it all for us – collect, visualize, track all metrics, on a large scale. The solution we sought would also be required to alert us with insights that would be automatically prioritized, thereby minimizing the potential flood of false alarms or low priority issues. When Operations Meets Innovation That’s when I met my partners: Ira Cohen and Shay Lang. Ira was a chief data scientist in the HP-software business and Shay was an old friend and an R&D manager at a security software company. We realized that by combining our expertise – my operational experience as CTO of several companies, Ira’s experience in inventing and applying machine learning algorithms on time series data, and Shay’s R&D skills, we could create the service that I saw was so critical to our market's needs. And that's how Anodot was born. More Than 200 Users and Growing During our year and two months of existence, we have already created a metrics service platform that tracks, visualizes, detects and alerts over 200 users about issues and insights affecting their businesses. These businesses include Ad-tech companies, web services, e-commerce, and even industrial Internet of Things (IoT) companies. And that’s just beginning…
Cloud Cost Monitoring
Blog Post 10 min read

How We're Cutting $360K From Anodot’s Annual Cloud Costs 

In this guide, we’ll discuss exactly what strategic actions you can take in order to cut cloud costs, and lay out how our company used a plan that integrated AI-based monitoring to effectively cut $360K from our cloud costs.
Blog Post 4 min read

Why Ad Tech Needs a Real-Time Analysis & Anomaly Detection Solution

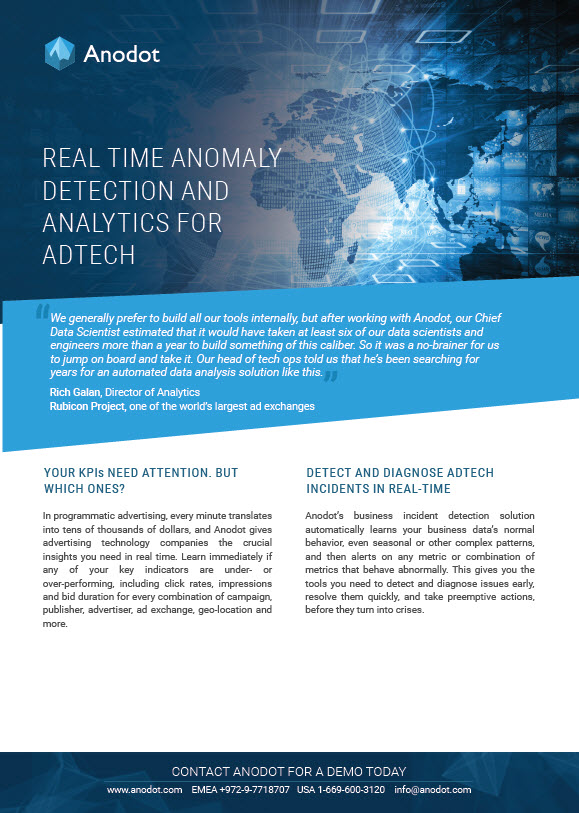
Better Ad Value Begins with Better Tools: Why Ad Tech Needs a Real-Time Anomaly Detection Solution An expanding component of today’s online advertising industry is Ad Tech: the use of technology to automate programmatic advertising – the buying and selling of advertisements on the innumerable digital billboards along the information superhighway. When millions of pixels of digital ad space are bought and sold every day, bids are calculated, submitted and evaluated in milliseconds, and the whole online advertising pipeline from brand to viewer involves several layers of interacting partners, clients and competitors - all occurring on the gargantuan scale and at the hyper speed of the global Internet. In this complex, high speed and high speed industry, money is made - and lost - at a rapid rate. Money, however, isn’t the only thing that changes hands. It’s the data – cost per impression, cost per click, page views, bid response times, number of timeouts, and number of transactions per client – which is as important as the money spent on those impressions because it’s the data which shows how effective the ad buys really are, thus proving whether or not they were worth the money spent on them. Therefore, the data is as important as the cost for correctly assessing the value of online marketing decisions. That value can fluctuate over time, which is why the corresponding data must always be monitored. As we’ve pointed out in previous posts, automated real-time anomaly detection is critical for extracting actionable insights from time series data. As a number of Anodot clients have already discovered, large scale real-time anomaly detection is a key to success in the Ad Tech industry: Netseer Breaks Free from Static Thresholds Ad tech company Netseer experienced the two common problems of relying on static thresholds to detect anomalies in their KPIs: many legitimate anomalies weren’t detected and too many false positives were reported. After implementing Anodot, Netseer has found many subtle issues lurking in their data which they could not have spotted before, and definitely not in real time. Just as important, with this increased detection of legitimate anomalies came fewer false positives. Anodot’s ease of use, coupled with its ability to import data from Graphite is fueling its adoption across almost every department at Netseer. Rubicon Project Crosses the Limits of Human Monitoring Before switching to Anodot, manually set thresholds were also insufficient for ad exchange company Rubicon Project, just as they were for Netseer. The inherent limitations of static thresholds were compounded by the scale of the data Rubicon needed to monitor: 13 trillion bids per month, handled by 7 global data centers with a total of 55,000 CPUs. Anodot not only provides real-time anomaly detection at the required scale for Rubicon Project, but also learns any seasonal patterns in the normal behavior for each of their metrics. Competing solutions are unable to match Anodot’s ability to account for seasonality, which is necessary for avoiding both false positives and false negatives, especially at the scale needed by Rubicon Project. Like Netseer, Rubicon Project was already using Graphite for monitoring, so Anodot’s ability to pull in that data meant that Rubicon Project was able to see Anodot’s benefits immediately. Eyeview: No More Creeping Thresholds and Alert Storms Video advertising company Eyeview had to constantly update its static thresholds as traffic increased and variability due to seasonality continuously made those thresholds obsolete. Limited analyst time that could have been spent on uncovering important business events was instead diverted to updating thresholds and sifting through the constant flood of alerts. Eyeview’s previous solution was unable to correlate anomalies and thus, unable to distinguish between a primary anomaly from an onslaught of anomalies in the alert storms. After switching to Anodot, the alert storms have been replaced by more concise and prioritized alerts, and those alerts are triggered as soon as the anomaly occurs, long before a threshold is crossed. Ad Tech needs real-time big data anomaly detection Anodot provides an integrated platform for anomaly detection, reporting, and correlation which you can leverage from a simple interface your whole organization can access. Whether you’re a publisher, digital agency or a demand-side platform, better ad value begins with better tools, and only Anodot’s automated real-time anomaly detection can match the scale and speed required by Ad Tech companies.
Blog Post 3 min read

3 Approaches to Intelligent, Proactive Monitoring & Anomaly Detection

Capping off a busy and productive week at Strata + Hadoop World where Ira Cohen, our Chief Data Scientist, led a presentation on the need for anomaly detection on mobile apps, we were pleased to be part of the  San Jose Meetup: Finding the needle in the haystack. Nearly 100 people (standing room only!) came to hear about anomaly detection for proactive monitoring from PayPal, Uber and Anodot, hosted by PayPal in their Town Hall building. PayPal’s Proactive Monitoring Transformation The evening started out with a presentation from Bryant Chan, PayPal’s Director of Engineering, who leads the monitoring and logging team. Bryant described the problem of inadequate monitoring that many organizations face today and went on to explain how PayPal is transitioning their monitoring to be more proactive and intelligent. It was interesting to learn how PayPal is blurring the borders of traditional logging and monitoring to create one unified platform that enables them to reach the highest standards of availability at scale. Bryant shared their current architecture which leverages open source technologies including Kafka, Druid, OpenTSDB and Elastic to handle the huge volume of transactions. He also talked about the need for smarter solutions that enable fast detection and - most importantly - faster root cause analysis, and what they are doing in the anomaly detection space to achieve this. Uber’s Challenge: Make Transportation as Reliable as Running Water Next up was Franziska Bell, Data Science Manager at Uber, who discussed how her company developed its own in-house anomaly detection solution. Three years ago, Uber realized they needed an anomaly detection solution to realize Uber’s mission to make “transportation as reliable as running water.” Since then, the company has worked to develop a solution to detect anomalies for their more than 500 million metrics. Fran described the requirements of an anomaly detection system and what they have achieved so far, which was very impressive. She noted that the solution is a work in progress because with so many metrics (increasing in double digits % on a monthly basis), it’s a huge problem to tackle. Currently in process are improvements in different models for what is considered “normal” and correlating alerts for quick investigation. Anodot Presents Autonomous Analytics Finally, Ira Cohen presented “Autonomous Monitoring,” the central concept behind the Anodot solution, enabling organizations to perform any type of analytics (i.e. past, real-time and predictive) on practically any data with minimal configuration. Below is Ira’s full presentation which goes through an example of a successful mobile application that suddenly sees a steep increase in the number of uninstalls and explains how Anodot’s real-time anomaly detection solution helps uncover exactly what happened to cause this behavior so that the development team can fix it quickly.     After the sessions, everyone was invited to mingle and speak with the presenters. Everyone had the opportunity to ask questions, exchange business cards and network. Special thanks to Uber and PayPal for joining us for this informative and successful event! We look forward to meeting you at our next event.
Blog Post 1 min read

Case Study: Rising up with Monitoring All IT & Business Metrics

Online businesses are a natural fit for Anodot, and we are seeing rapid adoption in companies that live and breathe the online world, and live and breathe data. For Uprise, data is central to everything they do. In fact, once they implemented Anodot to monitor...well, EVERYTHING, every person in the company from devops and business intelligence all the way up to the CEO are using it. Rather than select what to monitor, Uprise's CTO Doron Ben-David feels it's better to simply monitor everything, now that he can. “My philosophy is, if you can think about it, you can monitor it or put it on a graph,” Doron said. “Now that we have Anodot, I have asked our developers to push everything into Anodot so we can see how the data behaves. We add new metrics to Anodot every day.” Read the full Uprise case study here.  -- image: Wikipedia