
Written by @InterpretableAI & @IraIraCohen
Over the last decade, data collection has become a commodity. Consequently, there has been a tremendous deluge of data in every area of industry. This trend is captured by recent research, which points to growing volume of raw data and growth of market segments fueled by that data growth:
- Mobile data growth is expected to grow to 164 exabytes/month by 2025, a 5x increase from 2019.
- The proliferation of machine data will be further accelerated by IoT. As per IDC, there will be 41.6 billion connected IoT devices, generating an estimated 79.4 zettabytes (ZB) of data in 2025.
- Streaming analytics market is expected to grow to USD 38.6B by 2025, at a Compound Annual Growth Rate (CAGR) of 25.2 percent, according to MarketsandMarkets research.
- With the increasing trend in cyberattacks, security analytics will play a critical role going forward. To this end, as per MarketsandMarkets research, security analytics market size is projected to grow to USD 18.1B by 2024, at a compound annual growth rate (CAGR) of 18.2 percent.
- As per, “Genomical” data alone is predicted to be in the range of 2–40 exabytes by 2025. Fortune Business Insights forecasted the global healthcare analytics market size to reach USD 80.21B by 2026, at a CAGR of 27.5 percent.
As organizations become more data-driven, they find themselves unable to scale their analytics capabilities without the help of automation. Artificial intelligence is being used to automate processes from recommendations and bidding, to pattern detection and anomaly detection. (For a deep dive on the wide applicability of anomaly detection, please refer to the white paper, “Intro to Anomaly Detection”.)
Although there exists a large family of techniques for anomaly detection, most of them are geared towards unidimensional time series. This is often very limiting owing to the multi-dimensional nature of contemporary datasets. For instance, in today’s microservices-based architectures (which routinely comprise of thousands of microservices), analyzing data of individual microservices would, most likely, mask key insights and thereby impact the business adversely.
To this end, we at Anodot marry our anomaly detection framework with correlation analysis to help find the proverbial needle in a haystack. Applying anomaly detection on all metrics and surfacing correlated anomalous metrics helps draw relationships that not only reduce time to detection (TTD) but also supports shortened time to remediation (TTR). Another important benefit of correlation analysis is in reducing alert fatigue by filtering irrelevant anomalies (based on the correlation) and grouping correlated anomalies into a single alert. The latter is a pain point many organizations face today – getting hundreds, even thousands of separate alerts from multiple systems, when many of them stem from the same incident.
The graphs below demonstrate anomalies in an ad revenue application that Anodot detected and correlated in real time.
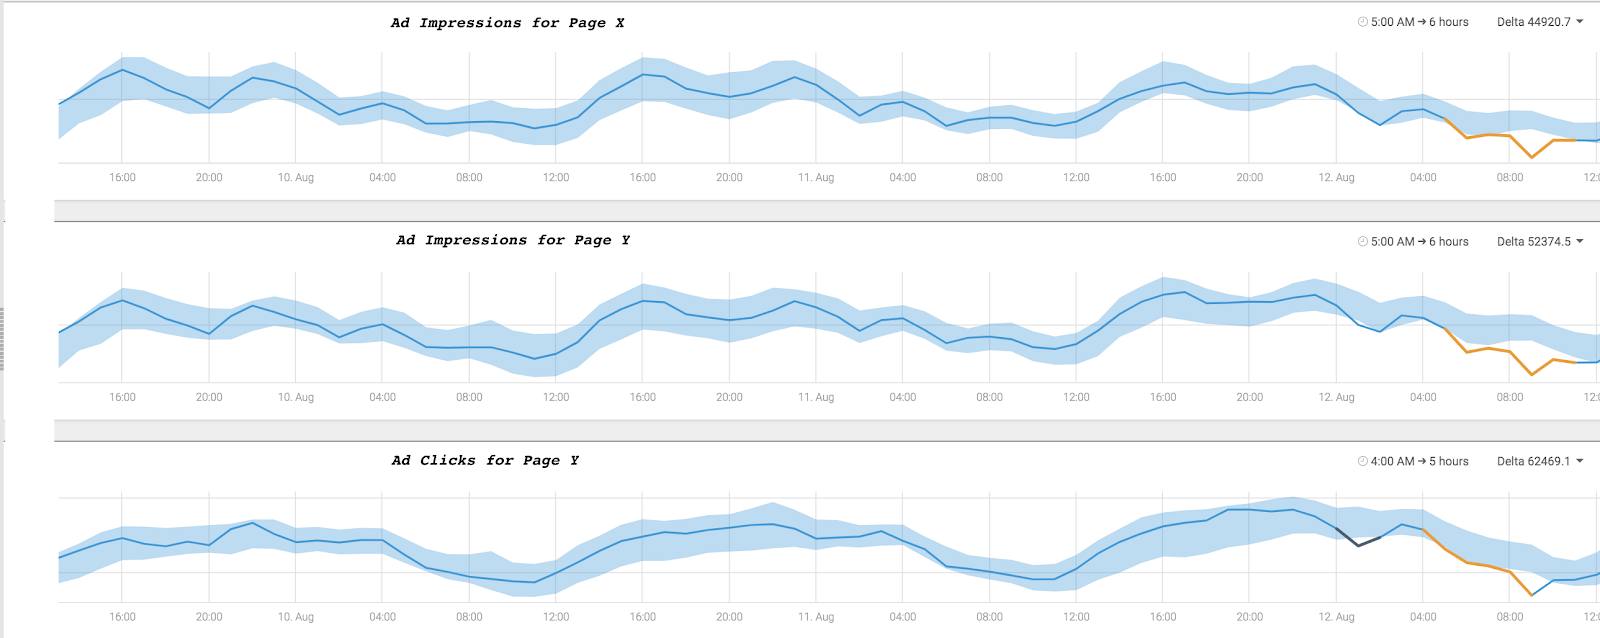
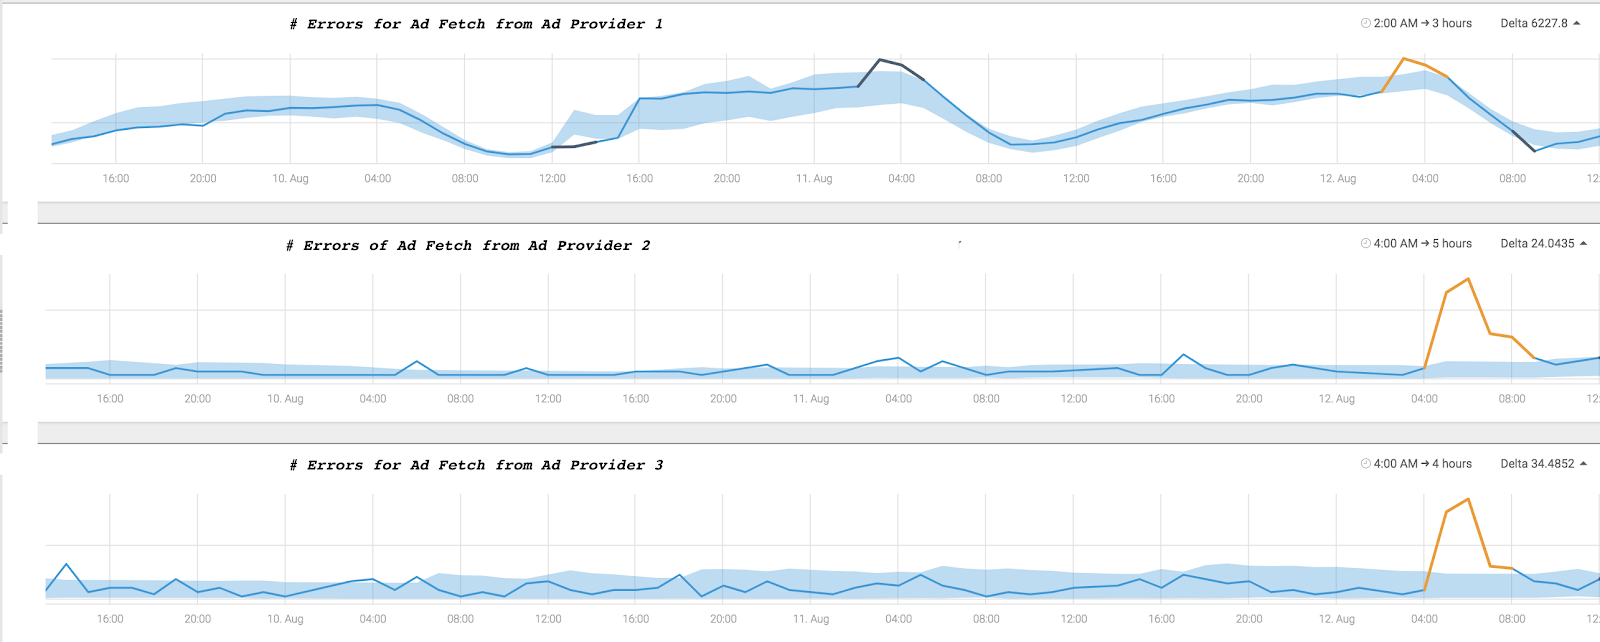
A drop in ad impressions and clicks on two app pages, were correlated with an anomalous increase in errors fetching ads from three different ad providers. This correlation prompted the team to quickly discover a bug in a release, which caused the errors in fetching a portion of the ads from various providers. They released a hotfix the errors returned to their usual levels, bringing back ad impressions and clicks to their normal levels as well.
As data-driven decision-making has become the norm, early and robust detection of anomalies is critical in every industry domain, as delayed detection adversely impacts end-user experience and/or the top line for the business. Examples include:
- PROMOS: Amidst COVID-19, small businesses have been hit very hard. As these businesses move online, being able to effectively run promotional campaigns has become more critical than ever. There is a wide spectrum of factors at play to this end – desktop/mobile, frequency of rollout, dynamic evaluation between different promotion types – and they require advanced conjoint analysis for hyper-targeting. Having said that, in most cases, there are multiple concurrent promotions in flight. Being able to surface early which promotions are, and aren’t, working well and understanding the key underlying drivers can potentially boost sales by optimizing the promotions strategy.
- TELCO: With the digital transformation of the telco industry, networks are becoming increasingly complex, as are their services. The network is one of the most complex areas to manage and monitor, with RAN, Mobile and IP core, transport and applications just a few among tens of integrated components. In many cases, one KPI alone isn’t enough to surface an outage – detection depends on correlation of multiple anomalies.
Correlation analysis is also an effective way to gauge the many ways an incident is impacting users. One of the biggest challenges today is those network monitoring solutions which are threshold/rule-based can only generate alerts based on pre-defined KPIs. For more accurate detection, these systems need to correlate KPIs to create new alarms that indicate real customer impact.
-
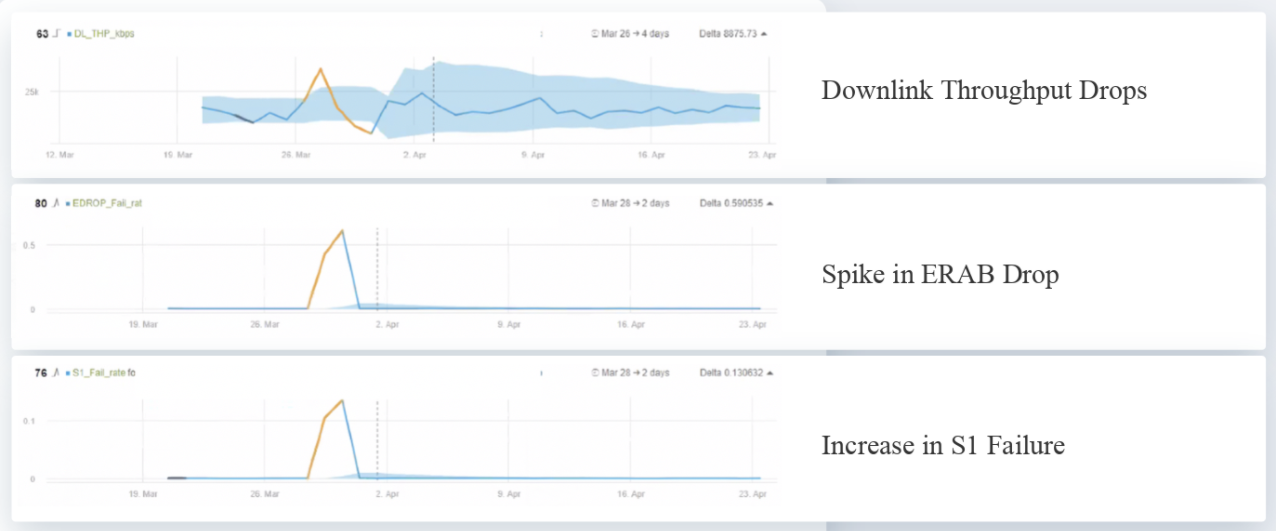
- Sleeping cells are a great example, as there is no ONE specific KPI that indicates the cell is not working. The real monitoring is being done by the customers that call and complain. Using AI-based anomaly detection with advanced correlation capabilities is the only way to raise such an alarm. The correlation will use different KPIs (such as drop in downlink throughput) and will compare it to the data to analyze the actual root cause.
-
- Another example is when customers can’t connect to the LTE/3G data network. Only by correlating between different KPIs (such as attach failures for MMEs with an increase in messages across the S6a interface) does the impact on customers become clear.
- LIVE STREAMING PLATFORMS: Live streaming platforms such as Twitch are becoming increasingly popular. Being able to interact with fellow gamers boosts the overall experience. Having said that, unfortunately, bad actors on the platform drive harassment, thereby adversely impacting engagement. By leveraging existing literature in statistical/deep learning on multi-dimensional time series and by correlating various behavioral signals, one can detect and ward off bad actors.
- HEALTHCARE: Healthcare data in particular is characterized by a wide variety of data types/formats – both structured and unstructured, such as:
- Electronic health records, medical imaging data, medical device and biometric data
- Data from wearable devices (such as activity trackers and Apple Watches), smartphone apps and equipment tracking sensors
- Data related to payer records, public records, search records, etc.
- Genomic sequencing data
Cross-analyzing data from different sources can help to guide early diagnosis and drug research, surface data governance irregularities, and more. A discussion of recent advances in healthcare rooted in big data analytics and deep learning is available in:
- As more applications move to the digital sphere in the post COVID-19 world, providing high availability, performance and reliability have become basic expectations. The ever-growing complexity of modern applications has resulted in an explosion in the volume of operational data. Finding potential issues – aka anomalies – with high fidelity remains a huge challenge.
There are many complexities and hurdles in coupling correlation analysis with anomaly detection, such as:
- Missing data
- Change in underlying data distribution
- Unevenly spaced time series data
- Presence of anomalies which skew the computation of certain types of correlation coefficients
- Dataset being multi-modal – comprising of one or more of the following: text, images, audio or video
Besides the aforementioned, perhaps the most critical challenge is carrying out correlation analysis in context. From a strictly mathematical perspective, correlation can be determined between any two time series. But without regard for the context, more often than not, the exercise may result in spurious correlations. For more on the subject and how it can mislead decision-making, we recommend reading:
- “An Example of Spurious Correlation”, Nature
- “Spurious Correlation and Its Significance to Physiology”, Journal of the American Statistical Association
- “A Study of Spurious Correlation”, Journal of the American Statistical Association
- “Spurious Correlation: A Causal Interpretation”, Journal of the American Statistical Association
- “The Spectre of ‘Spurious’ Correlations”, Oecologia

And for a bit of humor, check out Tyler Vigzen’s project documenting a variety of spurious correlations.
This article is the first in a series on correlation analysis, including the different flavors and applicability to different data types. In the follow-up, we dive into the different types of correlation coefficients and how to compute the robust variants – which may be unsusceptible to anomalies. We also look at how to handle different data types – continuous, discrete, categorial, etc. – and new datasets such as, but not limited to, graphs. We shall close the series with a discussion around correlation vs. causation, and how correlation is also being leveraged in the deep learning context.
Continue this series to discover applications of and challenges with applying correlation analysis in:
- eCommerce, specifically promotions
- telecommunications, specifically network performance
- fintech, specifically algorithmic trading


