Companies invest in anomaly detection in order to proactively identify risks, such as revenue loss, customer churn and operational performance issues.
Anomaly detection essentially enhances traditional BI and visualization tools, venturing beyond a summary view of your data. It constantly scans every metric, at a granular level, to find abnormalities.
Can you afford not to use the best anomaly detection out there?
But in order for this technology to have an impact, you must be able to trust it. In other words, the quality of detection is critical to successful adoption of such technology, and the key is a perfect balance between accuracy and relevancy.
You shouldn’t have to tolerate a noisy system, an inbox filled with false positives, and the ensuing alert fatigue. In this case, it’s only a matter of time before you miss that critical notification you were trying to prevent in the first place.
So here I argue that a less-than-ideal system may kill trust and lead to indifference.
Amazon recently commoditized anomaly detection features into their BI offering Quicksight. It is a BI platform with an embedded “ML anomaly detection” component. I was curious to see how this ML anomaly detection measured up against Anodot and essentially conducted a blind test to evaluate the quality of detection. Read on to see how the solutions compared.
What is Quicksight Anomaly Detection?
At its core, Amazon Quicksight is a BI service that lets business users easily create dashboards and visualizations of their business data, interact with it and mine for insights.
The company recently integrated its own machine learning anomaly detection capability into the Quicksight product. With this add-on, users can subscribe metrics from a given Quicksight data mart to be scanned constantly, and receive alerts when anomalous data behaviour is detected.
Testing Detection Quality: Quicksight vs. Anodot
To evaluate both systems’ ability to detect incidents at varying levels of sensitivity, I uploaded two sets of actual business data. Both data samples were identical and included several degrees of anomalies.
Top-of-Funnel eCommerce Use Cases
The data represents five days of hourly website traffic (visits), grouped and analyzed by different dimensions such as website domain and traffic source. There were 35,000 distinct metrics submitted for analysis.
Test #1
This data represents five days of hourly visits for website domain #1.
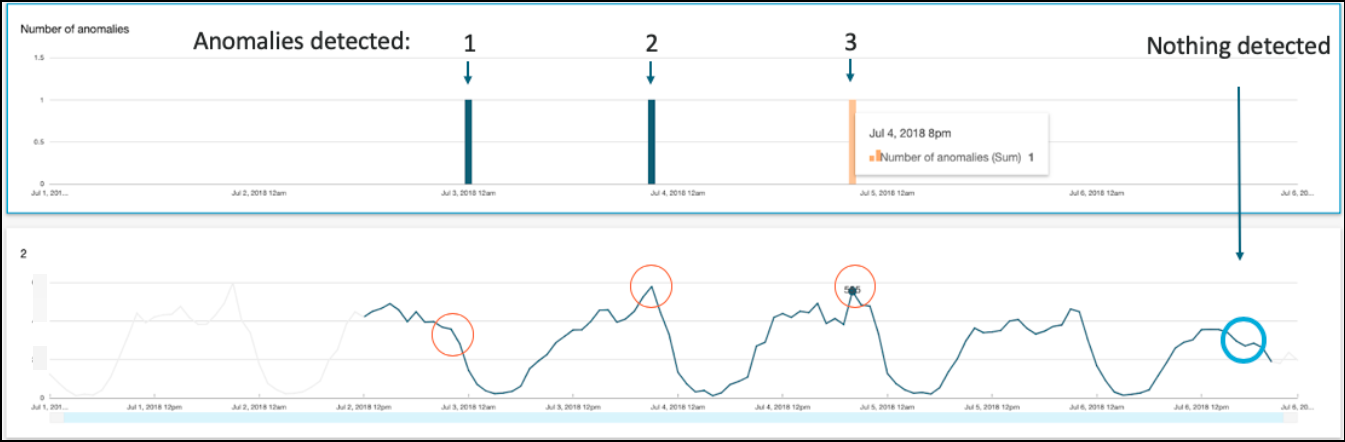
Quicksight results: Quicksight reported that three hour-long traffic upswings were anomalies.

Anodot results: Anodot detected a single anomalous drop in traffic ( -50K visits) lasting four hours.

Review: Quicksight failed to identify a drop of 50,000 visits to the site on July 7 as an anomaly, while falsely identifying three other traffic upticks as anomalous.
Anodot detected the real issue in visits at the very first hour of occurrence (see the graph’s red marker), which lasted four hours until it was addressed by the customer. Otherwise, it could have been worse.
The three other false-positive anomalies detected by Quicksight were not classified as anomalies by Anodot (see the graph’s black markets), keeping the business user-focused only on true incidents.
Test #2
Data represents seven days of hourly visits from a specific data source (one out of many).
Quicksight results: Three hour-long anomalies were detected.

Quicksight not only falsely classified two periods as anomalies, it failed to identify a critical drop in website traffic. On Aug. 6, visits dipped and were 180,000 lower than the seasonal figures expected for that time period. This anomaly should have been reported.
Anodot results: Anodot reported the anomalous drop in traffic as lasting six hours, and accurately quantified the drop as 180K visits below the baseline.

Review: Anodot identified the issue and alerted immediately on Aug. 6 at 12:00 (see the graph’s red marker). The three other false-positive anomalies detected by Quicksight were not classified as anomalies by Anodot (see the black markers).
Anodot’s results show superior detection quality and demonstrate how users receive accurate alerts with less noise.
When using both services, I came across a few additional points of comparison one may want to consider when adopting anomaly detection.
Baseline Indication
In Anodot, anomalies are presented in comparison to the “baseline” – a shaded area indicating the normal range expected for that metric. With this baseline, it is easier for the user to visually distinguish between what’s “regular” from an anomaly. Additionally, Anodot presents the delta (nominal gap) between the actual value and the edge of the baseline to use as a filter for alerts (e.g., issue an alert only when the delta is greater than 250 visits/hour).
As is seen in the graphs above, Quicksight shows the anomalous point in time, but with no basis for comparison.
Interval vs. Discrete Detection
In Quicksight, anomalies are presented discretely, point by point. If an anomaly lasts longer than a single occurrence, it will be identified as several events. For example, if an anomaly is four hours long, then the output in Quicksight would show as four separate anomalies, generating a lot of noise and false-positives.
In Anodot, anomalies are treated as intervals, preventing redundant alerts and giving a clearer indication of an ongoing anomaly. Moreover, alerts can be muted if the interval lasts less than a critical duration (e.g., an alert is prompted only if it lasts two hours or more).
Anomaly Correlation and Anomap
More often than not, a problem in one place can relate to other errors occurring at the same time. Therefore, understanding how different active anomalies correlate can expedite root cause investigation and shorten the time to resolution.
Anodot bands groups of different anomalies (or “incidents”) that together tell the story of the phenomena. These can be (a) multiple anomalous values in the same dimension (e.g., a drop in traffic from sources A and B, but not C, D or E), or (b) correlation between different anomalous KPIs, such as visits, conversions, orders revenue, error rate.
Each incident has an Anomap, a graphic distribution of the dimensions most impacted. This is essentially a heat map that makes it much easier to understand the whole picture.
Take the case of online gaming. Imagine in-app purchases dropped for a particular game. You could investigate the Anomap below and determine see the primary dimensions affected, including the primary devices, regions, item numbers and sources. In this instance, it’s clear that table users in North American and Japan are primarily impacted.

Unfortunately, Quicksight offers no such features and it is much more difficult to understand the root cause of related anomalies.
Time to Resolution
Quicksight’s ML minimum rollup is hourly. Anodot supports the minute level right out of the box, and supports all native functionality around it.
Processing Times
For on-time detection processing, speed is a key factor when scale and immediacy are of the essence. Quicksight’s ML processing time was measured at 2.5 minutes to retrieve a single metric based on the data tested here. This can lead to delayed detection and postponed alerts for the end-user.
Compare this with Anodot’s near-instant processing time and the ability to alert immediately when something is wrong. This capability is critical for reducing time to detection and time to resolution.
Total Cost of Ownership
Anodot’s pricing is clear and transparent, with a known fixed price per month based on the number of metrics you wish to analyze. The price includes all product features and analysis of all time resolutions per metric – there’s no hidden charges and no surprises.
We looked into pricing for Quicksight Anomaly Detection and learned there’s an additional cost feature on top of the Quicksight basic offering, which is dependent on some dynamic factors such as the number of values in the data or number of time resolutions used. As a result, the BI analyst using it won’t know exactly what’s the cost of the operation they just submitted, and may be surprised with the associated fee.
Conclusion
AI analytics and anomaly detection are increasingly essential to the data stack, particularly for companies managing massive data, making quick decisions and that have a high potential for damage. If you’re looking to add or improve AI/ML anomaly detection capabilities within your organization, I invite you to rethink what it means to use a mediocre solution, rather than using the best one for the job.
While it is no secret that I’m a big advocate of Anodot, with these results it’s not hard to see why. With a highly accurate quality of detection based on our core AI/ML capabilities, together with our supportive functionality and feature sets, Anodot eliminates noisy results and false-positives. It alerts business users’ to what’s critical and it does so in real time, consequently gaining their trust. And when you’re investing in an anomaly detection solution, you should be confident you’re using the best out there.
The Breakdown
| Feature | Quicksight | Anodot |
| Applies multiple algorithms to support a variety of time series | ✗ | ✓ |
| Automatically evaluates and selects the optimal model | ✗ | ✓ |
| Provides visual baseline of the normal range | ✗ | ✓ |
| Average time scale for analysis and alerting | Hour | Minute |
| Data delay handling | ✗ | ✓ |
| Alert Consolidation | ✗ | ✓ |
| Alert Simulation | ✗ | ✓ |
| % and Absolute Delta (gap from the norm) | ✗ | ✓ |
| Anomaly Interval | ✗ | ✓ |
| Push alerts via business applications & workspace integration
(Slack, API, email, PagerDuty, etc.) |
✗ | ✓ |
| Self-service alert tuning | ✗ | ✓ |
| Responds to varying degrees of urgency and different recipient groups | ✗ | ✓ |
| UI-based investigation of anomalous metrics | ✗ | ✓ |
| Heat Map | ✗ | ✓ |
| Display of external user events support | ✗ | ✓ |
| Hashtagging & Annotation | ✗ | ✓ |
| Complimentary Onboarding Training | ✗ | ✓ |
| Support & CS | ✗ | ✓ |
| Anomaly direction specified (up/down) | ✓ | ✓ |
| Auto-Learning of normal behavior | ✓ | ✓ |
| Anomaly Scoring | ✓ | ✓ |
| Feedback Loop | ✓ | ✓ |
| Contribution analysis support | ✓ | ✓ |


