
“Garbage in, garbage out”, as they say. This isn’t the end of the story, however. Organizations have the ability to clean their data and get better results, but the problem is that this is a labor-intensive process. What’s worse is that the longer it takes for you to clean your data, the more time it takes for you to use your data to make decisions.
To summarize: you can fix your “garbage” data, but it will cost a lot, take a long time, and delay your ability to capitalize on the results of analysis.
Where does bad data come from?
Flaws in the ETL pipeline can be a major source of both bad data and data delay. When raw data from your environment is converted into a form that can be understood by analysis tools, it can easily be corrupted. This isn’t due to flaws in your data collection processes – rather it’s due to the fact that ETL tools can be easily confused.
Here’s an example: let’s say you’re transforming data from two branch offices – one in the US, and one in the EU. The US office uses the date format MM/DD/YYYY, and the EU office uses the format DD/MM/YYYY. Halfway through your data set, the date format switches. The ETL tool doesn’t notice the difference, and all of the data shows up out of order. Time to run it again.
This is just the way it is. Most corporate data contains similar inconsistencies – and up to 90% of data is unstructured, meaning that it doesn’t fit into the context of a traditional database. Although it’s certainly possible to massage this data before it goes into your ETL tool, manual error correction methods probably won’t scale.
Similarly, simply watching the ETL monitoring dashboard as it runs is not likely to be a productive use of time. According to research from IDC, two thirds of companies report that their data is up to five days old before it comes out of ETL and hits an analysis tool. Here’s the kicker — that data is from 2017, two years ago as of this writing. Although ETL tools may have gotten faster in that interval, the sheer amount of data they must process has gotten larger, with global data production expected to reach 44 zettabytes in 2020. If a faster tool is expected to process a larger amount of data, the net result is likely to be a wash.
In any event, can you imagine staring at an ETL monitoring dashboard for five days while a batch process completes? Fortunately, there’s a better way.
Automated Anomaly Detection Streamlines the ETL Process
Let’s return to our date format example above. At the moment when the date format changes, you want a monitoring tool in the loop with the capability to identify the error, alert on the error, and pause the ETL process until the error is fixed. The tool could even potentially perform root cause analysis, shaving hours off the time it would ordinarily take to rectify an ETL failure. How does this work?
This tool starts with an ETL monitoring dashboard that learns key metrics. These may include how much data is being loaded into the tool, how many rows are being written, how long it takes to load in data, and so on. Based on your familiarity with your own ETL software, you can tell when those numbers start to drift out of alignment.
This is still in the realm of manual monitoring, however. Your next step is to train a machine to do this job. Using the same data from your ETL monitoring dashboard, an AI with machine learning capabilities can build its own baselines – how many rows get written per minute, how missing records are uncovered for every data transfer, how long it takes to complete each step, etc.
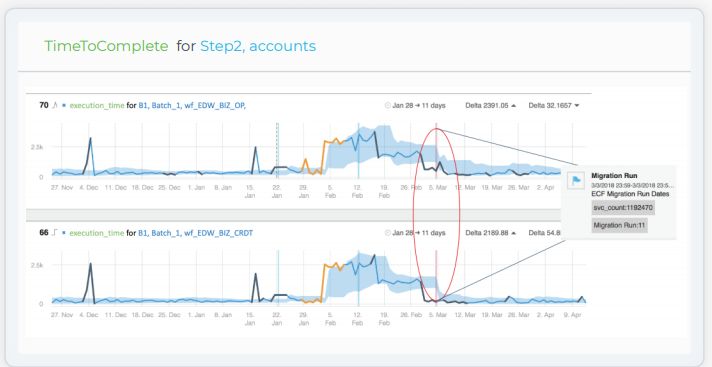
This dashboard monitors ETL extraction time.
This now gives you an advantage – your AI monitoring tool doesn’t have to sleep, so it can monitor the ETL process no matter how long it takes to run. If an alert takes place at 4:00AM, you don’t have to wait until 9:00 AM to discover the error. It’s also more sensitive when it comes to detecting anomalies, so it will alert on errors faster than a human observer.
More importantly, the system can understand where anomalies in the ETL process are taking place, allowing architects to address structural inefficiencies. This reduces the likelihood of ETL errors in the long run and shortens the overall ETL process.
Lastly, when the system detects errors in certain metrics, it can alert only those departments which are most likely to be responsible for handling the error. In other words, you’re only waking five people up as opposed to 20 people, and thus only have to pay those five people overtime. This kind of specific alerting lowers your operational costs while also leading to faster resolution.
Start Creating a Faster Analysis Pipeline Today
Instead of waiting through lengthy batch processes and then manually combing through the results to fix errors, data scientists can apply automated anomaly detection capabilities to monitor the ETL process. These applications can automatically find and fix errors, reducing the time it takes to receive accurate insights from your data.
To learn more, download the white paper “Why Automatic ETL Monitoring Ensures Data Quality” for steps on using AI anomaly detection to more efficiently monitor ETL performance.


