Cloud Cost Monitoring
Anodot catches runaway cloud spend immediately, alerts appropriate teams, and provides deep root-cause analysis across all your cloud resources.
Read more
Anodot works autonomously across all your application performance data to monitor, correlate, and alert in real time, surfacing mission-critical issues for your fastest time to resolution.
A late, misguided or missing response to critical application performance incidents has significant costs in revenue, time and brand reputation. Monitor your applications for anomalies in:
Latency
Throughput
CPU
Disk & memory usage
Process utilization
Error rates
Companies use many tools to monitor their applications. Something for server logs, something for application performance monitoring, something for the application framework, and even more internal tools. But these are static tools that build on siloed data and only address specific needs. Using them to manually create alerts and thresholds and to monitor metric pools in all the disparate systems is neither scalable nor sensitive enough to accommodate today’s business needs. Companies need to have a central repository for all metrics and all systems, taking advantage of machine learning and correlations across systems to achieve full visibility.
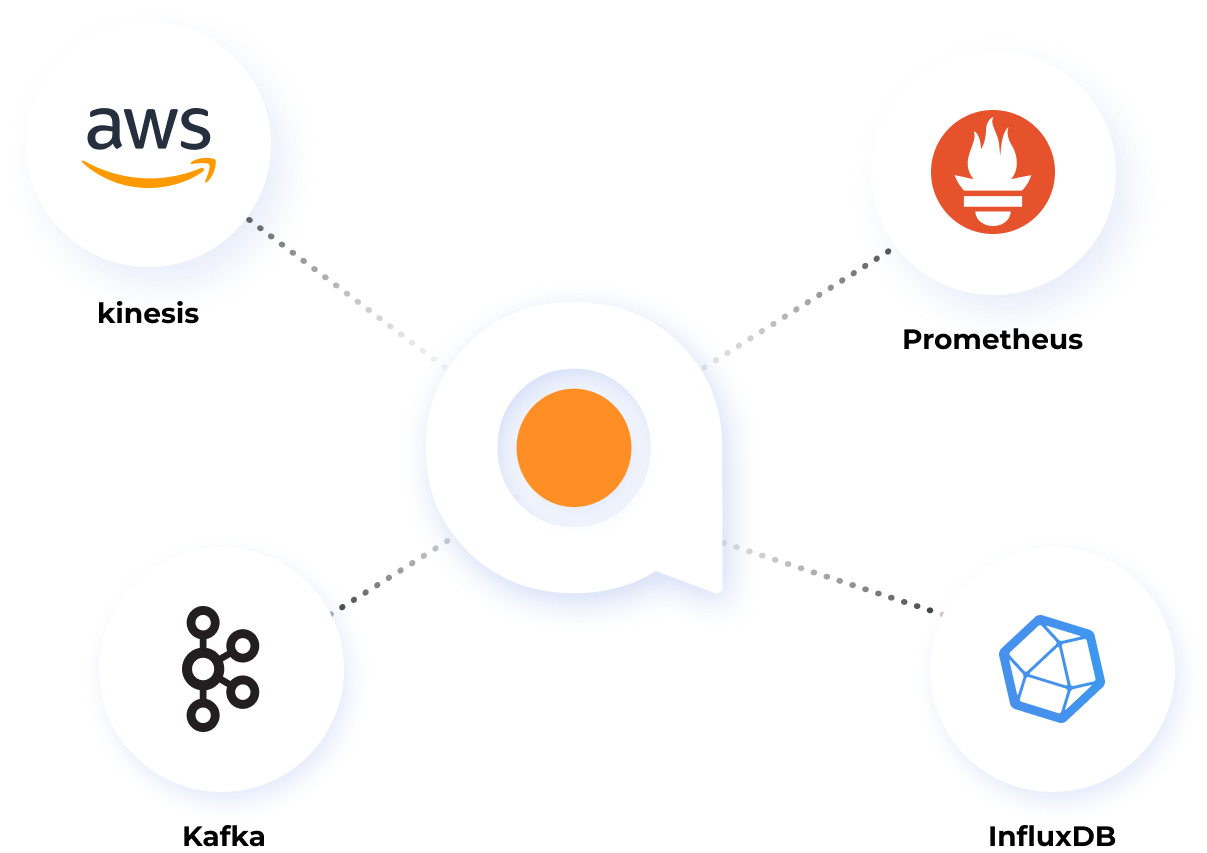
Anodot uses advanced machine learning to autonomously monitor 100% of your application performance data in real-time and learn the normal behavior of every single metric within minutes. There are no integrations or learning curves. Simply use one of our built-in collectors to connect and monitor the full scale of your application stack, stat.
With Anodot you can detect application errors faster and identify issues with the health of your applications. Anodot autonomously distills billions of data events into the single, scored, spot-on alerts that you need to know about right now. Relevant stakeholders are immediately notified via email, Microsoft Teams, Slack, PagerDuty or even Webhook.
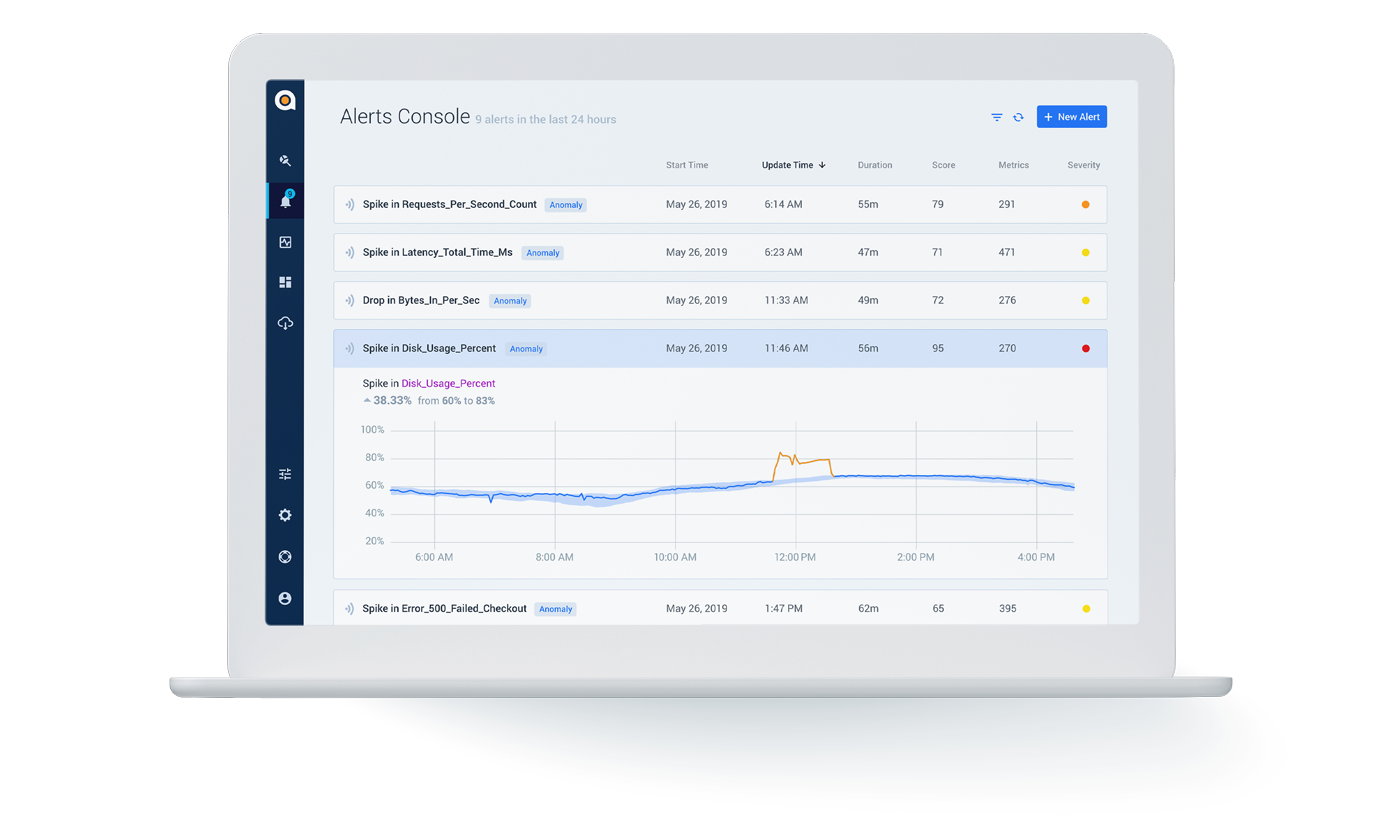
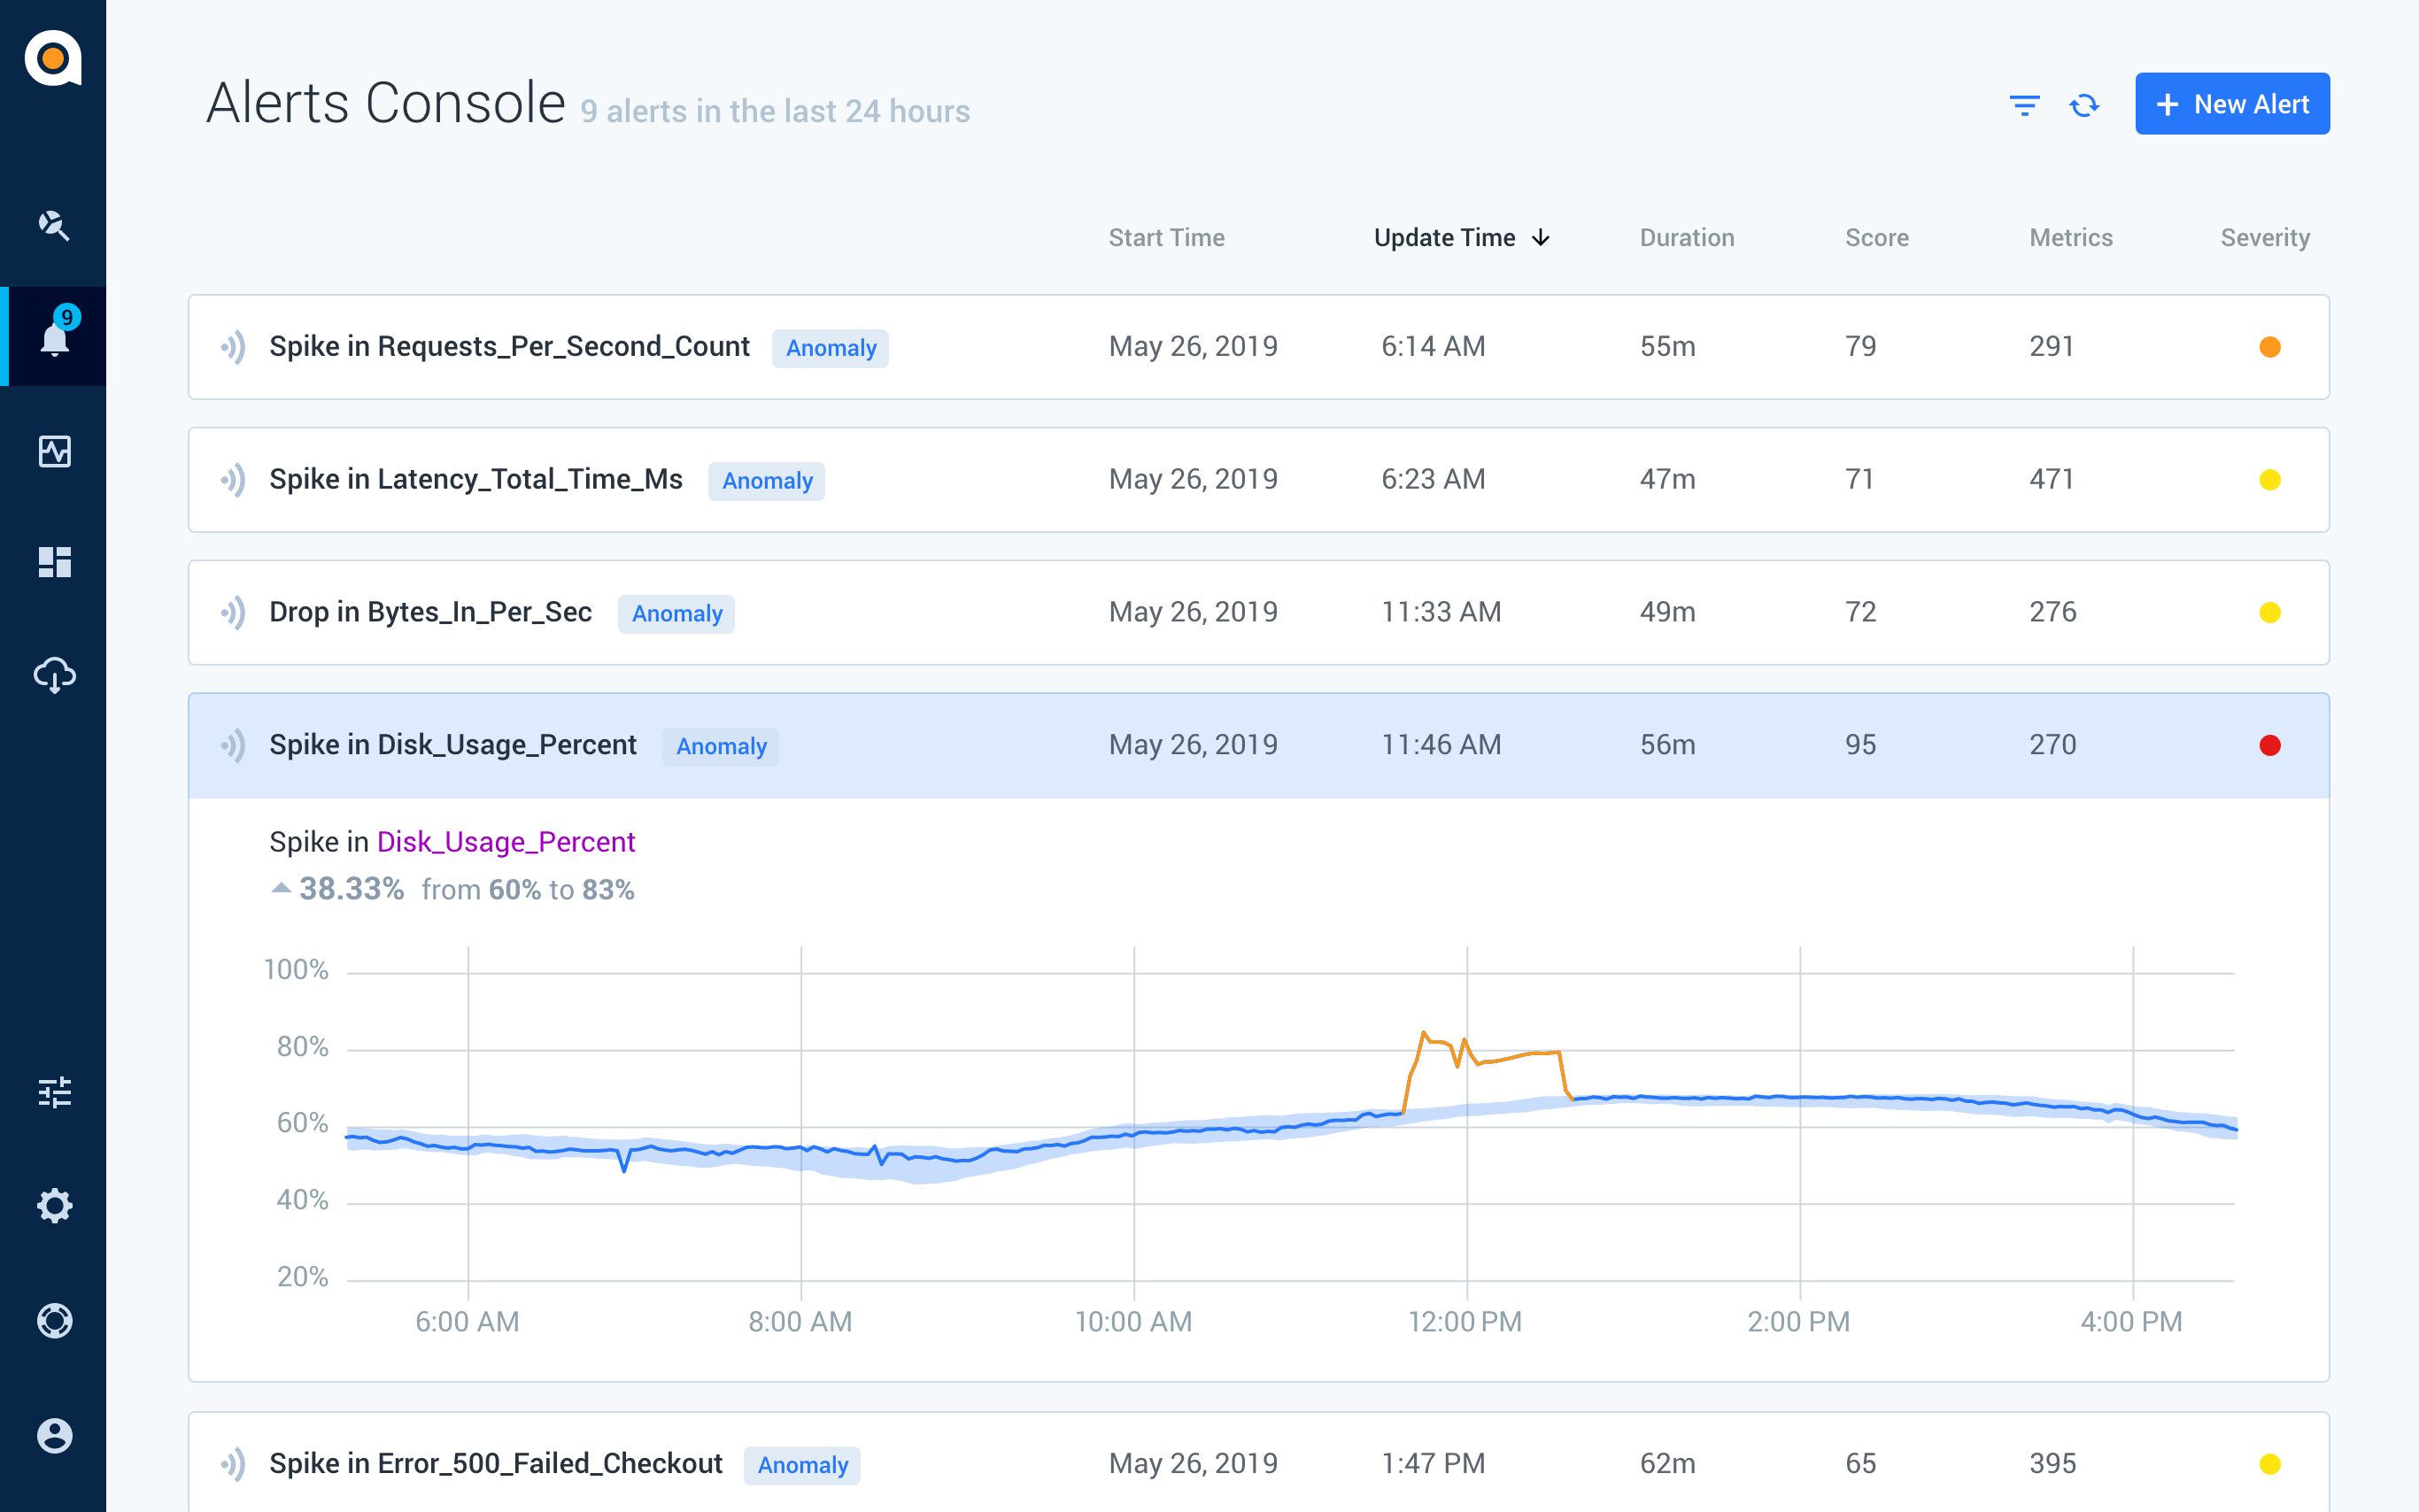
Eliminate alert storms, false positives, and undetected incidents. There’s no need to define what data to look for or when, no manual thresholds to set up or update. Monitoring your application for performance and errors with Anodot’s AI-driven anomaly detection is completely autonomous. Advanced error monitors can be easily created with Anodot’s adaptive alert dashboard.

Real-time high-definition coverage

Fastest incident detection and resolution

Fully autonomous analytics