Why could a spike itself not always be good news?
Why is it so important to find the relationships between time series metrics at scale?
Learn more in this article and watch this presentation by Anodot Data Scientist Inbal Tadeski at the O’Reilly Strata Data Conference.
Sunglasses Orders Suddenly Spike
Let’s start with an example from eCommerce. An eCommerce company is selling different products online. There is a sudden increase in the number of orders of sunglasses. Sounds great? With something good happening, then let’s look at some other measurements, to see that their revenue is also increasing accordingly.
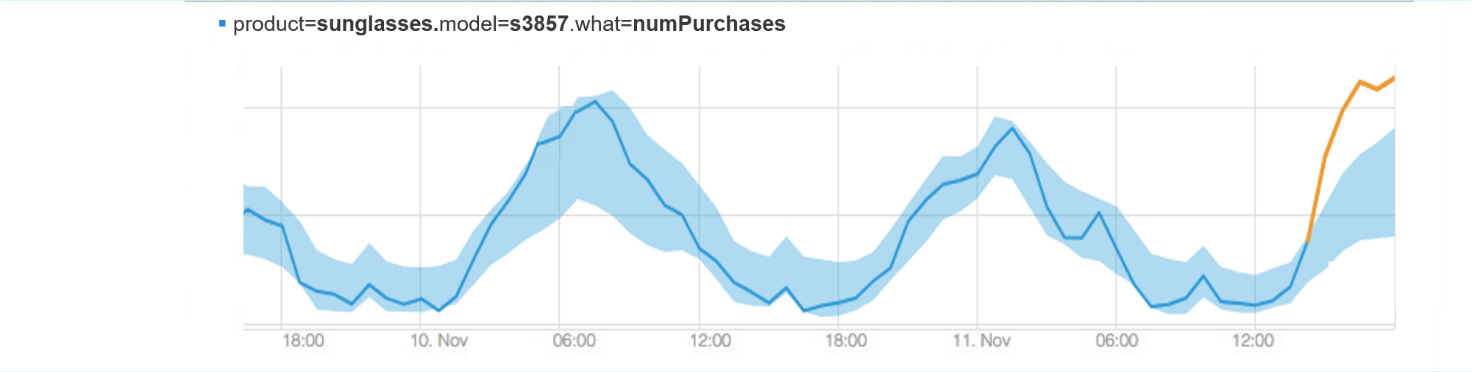
However you’ll want to understand why it’s happening. Looking deeper, you find out that a celebrity just posted this image on her Instagram, making the sunglasses very popular. Understanding this is a very valuable opportunity letting you immediately take action, and make sure to have enough sunglasses in stock.
Orders Spike and Revenue Leaks
Sometimes spikes themselves are not that good news. Take the following scenario: Again we have a certain number of order of the sunglasses, but when looking, if we only look at the number of orders then we may think that everything is OK. But when you start to look at other measurements, then you see that the revenue is not increasing as expected.
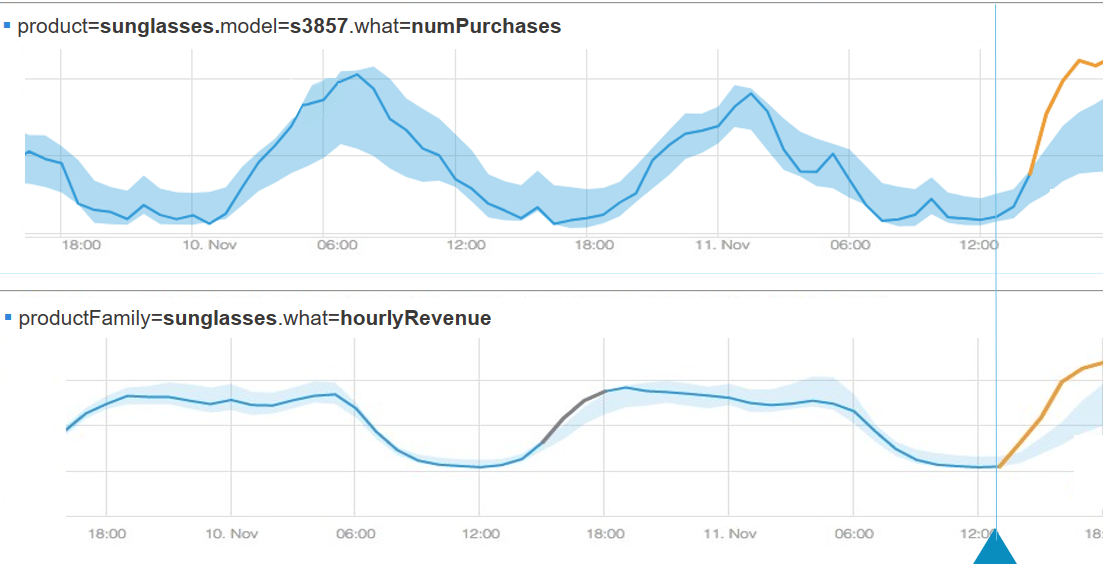
You can’t find any reason to justify this situation. Looking further on more measurements from different sources, you find that there is a growth in the number of mentions of your company’s app in Twitter. You go to Twitter to see what people are saying about you and bingo you discover you have a glitch. The website is selling the sunglasses for $2 instead of $50 by mistake. By crossing information from different sources, you can see the full picture and understand what’s really going on.
Correlating Information from Diverse Sources to Find Glitches
These stats are totally hypothetical, but glitches and breakdowns are opportunities you don’t want to miss, they all happen all the time for all companies. Here are just few such examples:
- Amazon web servers were down and cause problems all over the network
- United Airlines sold super cheap first-class tickets by mistake
The common thing about them is that without looking at correlating information from different sources it is very hard to understand that there is a problem, and to understand the full picture of what is really happening. Many things can cause breakdowns and slowdowns or opportunities.
Univariate Anomaly Detection
When you have a new partner integration then it could lead to slowdowns in your application, but also could lead to new opportunities. Device changes such as an operations system update and any external changes such as:
- media coverage
- holidays
- competitive strategy changes
- company changes such as a new version, deployment and promotions that can lead to changes.
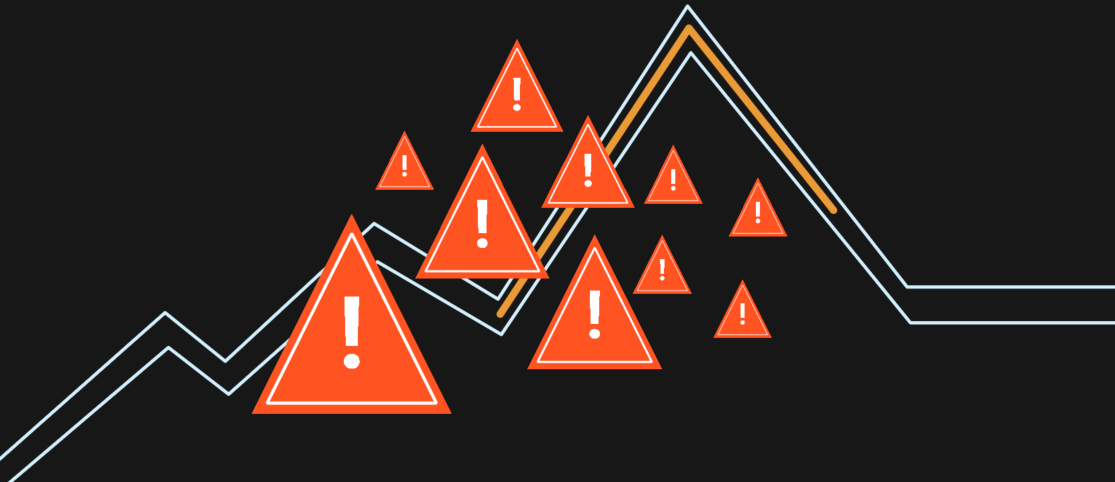
To check changes, businesses collect many metrics over time. By detecting the abnormal behavior for a single metric, we can understand that something is wrong. But univariate anomaly detection can create an alerts storm.
When such an event occurs, often there are anomalies in many other related metrics – each KPI has dozens of other related KPIs. By grouping related anomalies, you can bring order to a potential alert storm and get a full picture of what is happening.
Multivariate Anomaly Detection
As shown in the previous examples, we realize that it’s important to find the relationship between different metrics. Then, how do we handle multivariate anomaly detection?
Let’s look at how we do this at Anodot
- We start by collecting many metrics over the time, as businesses can collect millions of metrics.
- We learn the normal behavior of each metric separately using time series analysis techniques.
- Once we have the normal behavior model, we can detect abnormal behavior for each metric separately.
- We learn the topology behavior and the relationships between the different metrics, and group related anomalies.
- We can collect feedback about the anomaly and the relationships that we’ve detected and feed them back into our learning mechanism.
Continue reading the next part in the series “Metrics at Scale: How to Scale and Manage Millions of Metrics (Part 2)“.